
When you first dive into the ecosystem of Cool Google SEO Tools, the temptation is to treat them like isolated diagnostic stations—check the PageSpeed score, glance at the clicks in Search Console, and maybe peek at a real-time report in Analytics. But that approach misses the real power: these free, official instruments form a connected intelligence layer capable of pinpointing exactly why a page’s traffic collapsed, why a technical fix failed to move the needle, or where your competitors are leaving keyword gaps wide open. In this post, we’ll move far beyond the basics. You’ll learn how to combine Google Search Console, Google Analytics 4, PageSpeed Insights, Lighthouse, the Rich Results Test, Google Trends, and several lesser‑known utilities into workflows that reveal the kind of actionable insights most SEO audits charge thousands for. Whether you run a small WooCommerce shop or manage a portfolio of global B2B sites, you’ll walk away with techniques that turn these tools from checklists into genuine strategic assets.
Why “Cool” Doesn’t Mean Superficial: The Google SEO Toolset’s Strategic Core
The word “cool” tends to get attached to flashy visualizations or trendy features. Here, though, it means something different: capabilities that most users never discover because the underlying data is either buried in a secondary panel or requires cross‑referencing two tools to make sense. These are the features that separate the people who merely monitor from the people who diagnose. And diagnosis is where you find leverage.
A handful of Google tools form the unshakable foundation:
Google Search Console (GSC) for search‑query‑level truth and crawling intelligence.
Google Analytics 4 (GA4) for user‑behavior and conversion attribution after they land.
PageSpeed Insights (PSI) and its engine Lighthouse for Core Web Vitals and beyond.
Mobile‑Friendly Test and Rich Results Test for render‑side and structured‑data validation.
Google Trends for temporal and geographic demand signals.
If you stop at running each one separately, you’re seeing only a fraction of the picture. The cool part is stitching them together—using Search Console’s query filter to isolate a high‑impression, low‑click keyword, then overlaying GA4 landing‑page engagement to see if the page matched intent, then pulling a Lighthouse trace to check whether Cumulative Layout Shift demolished the mobile experience before the user could even read the headline. That’s the workflow we’re going to build.
Google Search Console’s Coolest Under‑Explored Powers
Everyone knows that the Performance report shows total clicks, impressions, average CTR, and average position. Yet this surface‑level view is dangerously crude. Average position alone can be a statistical lie—if you rank #1 for a low‑volume branded term and #38 for a high‑volume product term, your “average position” might look comfy while the majority of your impressions never generate a single click. The fix is granularity.
Attack the Query Filter Like a Surgeon
In the Performance tab, start by clicking + New, then Query. This is where the coolness lives. Type a single modifying word that represents the problem you’re trying to solve—price, buy, vs, free, review. Instantly you’ll see which search variations carry commercial intent and whether your pages are showing up for them. Filter for queries containing buy with a CTR below 2% and a position above 10. Those are your low‑hanging fruit: the page is visible enough to appear in the results but not compelling enough in its title tag or meta description to earn the click. Tweak those snippets and watch the clicks rise without any ranking change.
The “Compare” Dimension: Spotting Seasonality and Decay
Instead of looking at one date range, use the Compare toggle to overlay this month against the previous month, or this year against last year. When a site’s average position improves but clicks remain flat, Search Console’s query filter can help you isolate whether the gains happened on informational queries that don’t lead to conversions. That’s a precious insight—often the reason a traffic spike doesn’t turn into revenue. You can then direct your content strategy toward the transactional query cluster that actually needs the lift.
Index Coverage: The Hidden Warning System
Too many site owners only look at Coverage when pages are outright excluded. The real cooling‑off spot is the Warning category: Indexed, though blocked by robots.txt, Page with redirect, Alternate page with proper canonical tag. These are not errors, but they indicate that Google is using its own resourcefulness to decide what to index, and it may not match your intention. A canonical warning, combined with a GA4 landing‑page report showing zero entrances for the canonical version, tells you that your canonical signals are being overridden. That’s a technical SEO issue you can fix before it becomes a ranking problem.
Google Analytics 4: Building Cool Custom Reports That Mimic a Diagnostic Assistant
GA4’s shift from sessions to events and parameters is famously disorienting, yet once you master Explorations, you can build views that no third‑party tool easily replicates—views that directly answer SEO questions rather than just plop numbers in front of you.
The Landing Page × Search Console Query Gap Report
In GA4, create a Free‑Form Exploration. Set Rows to Landing page + query string, but here’s the trick: pull your query data from Search Console via the built‑in integration. GA4 can import GSC data and let you break landing‑page performance by query. Now configure Values as: Sessions, Average engagement time, Key events (conversions), and the Search Console metrics Clicks and Impressions. You’ll instantly see which landing pages capture clicks but fail to hold attention—high clicks, low engagement time, zero conversions. That’s a mismatch between search intent and on‑page content. The fix might be as simple as reorganizing your above‑the‑fold offer, but without this blended report, you’d have no way to know.
Traffic‑Source Nuances GA4 Hides by Default
GA4 bundles most organic traffic under “Organic Search”, but you can crack it open. Go to Acquisition → Traffic Acquisition, and click the + icon next to the table header to add a secondary dimension: Session source / medium. Then add a filter for Session medium matching “organic”. You’ll now see rows like google / organic, bing / organic, duckduckgo / organic. Export this and cross‑reference with GSC—GA4’s “Google / organic” may include clicks that GSC doesn’t report due to sampling or privacy thresholds, which can alert you to under‑reported long‑tail demand.
Cool bonus: use the Session default channel group dimension and compare “Organic Search” against “Direct”. If a huge chunk of your direct traffic lands on deep article URLs, it’s almost certainly organic traffic that lost its referrer due to HTTPS‑to‑HTTP stripping, sign‑in walls, or app‑to‑browser transitions. Treat that as organic for strategic purposes.
PageSpeed Insights and Lighthouse: Cool Diagnostics You’re Overlooking
Most people open PSI, groan at a 34 mobile score, and close it. But the real juice is in the filmstrip and the Diagnostic panel at the bottom of the Lighthouse report.
The Filmstrip Is Your UX‑Watchtower
After running a Lighthouse audit via PSI, scroll down to Screenshots. Hover over frame 00:00.0—what does the user see? If it’s a blank white screen until second 3.5, your Largest Contentful Paint (LCP) isn’t just slow; it’s destroying your first‑impression window. Now jump to the Performance tab in the top navigation, then click View Treemap. This visualisation shows you exactly which scripts are eating CPU time and delaying not just LCP but Interaction to Next Paint (INP). Often, a single third‑party chat widget is responsible. Removing it or deferring it can push you from 60 to 90+ without touching a single line of theme code.
The “Diagnose Performance Issues” Panel
Lighthouse doesn’t just give you scores; it gives you an ever‑expanding checklist of Diagnostics. Look for items like Avoid large layout shifts, Minimize main‑thread work, Reduce JavaScript execution time. Each of these has a clickable Learn More link, but more importantly, they’re attached to specific elements. Click the dropdown on Avoid large layout shifts and you’ll see the exact DOM node culprits. I’ve seen too many site owners obsess over the PageSpeed Insights score without opening the “Diagnose performance issues” panel, where the fix is literally highlighted with a CSS selector. It’s like having a mechanic tell you which bolt is loose and ignoring it.
Chaining PSI With Search Console’s Core Web Vitals Report
Search Console’s Core Web Vitals report groups pages by status: Poor, Needs Improvement, Good. Click into any group of Poor URLs, then run one through PSI. Compare the field data (what real Chrome users experienced) with the lab data (simulated). If the lab says LCP is 1.8s but the field says 4.2s, your real users are on slower devices or congested networks. That’s when you need to go beyond code‑level minification and consider a CDN with dynamic edge caching—or a service that engineers the entire delivery stack.
Google Trends and the Cool Art of Demand Forecasting
Google Trends is often treated as a novelty for comparing brand names. Underneath, it’s a demand‑forecasting engine that produces near‑real‑time signals you can’t easily get elsewhere.
Breakout Terms: The Early‑Warning System
In Trends, search for a broad category term, then scroll to the Related queries section and filter by “Top” and “Breakout.” Breakout means the term grew by more than 5,000% in the selected period. These are emerging verticals—sometimes cultural fads, but often new product categories, technologies, or problems your audience is just starting to articulate. A B2B equipment manufacturer noticing “maintenance‑free bearing” breakout in Germany can build an SEO‑optimized product page before competitors’ tools even register the volume. That’s competitive intelligence at zero cost.
Geographic Layering: Where Is the Demand Living?
Many businesses default to targeting English as a monolith. Use Trends’ Subregion filter. If you see a disproportionate surge in Mumbai for a keyword around financial compliance, you might want a dedicated India‑facing subfolder or a content series addressing RBI regulations. Search Console’s country‑filtered query data can then validate whether you’re capturing that demand.
The Integration Super‑Framework: Solving a Real Problem With Multiple Tools
Here’s a scenario that threads these tools together into a cool, repeatable diagnostic workflow.
Scenario: A WordPress B2B site’s blog traffic dropped 40% after the last Google core update, but the technical team insists scores are fine.
Step 1 — GSC Date Comparison: In Search Console’s Performance report, set the date range to compare the 28 days after the update with the 28 days before. Group by Page. Sort by Clicks Difference. Identify the most penalized URLs.
Step 2 — Query‑Level Impact: Click on a top‑10 dropped page, then switch the grouping to Query. You’ll see that certain queries that previously brought traffic have completely vanished—likely because Google now ranks a competitor’s more comprehensive resource above you.
Step 3 — GA4 Landing‑Page Content Check: Open GA4 and, in an Exploration, isolate that same landing page. Look at User engagement and Views per user. If engagement is strong but organic traffic fell, it’s not a content quality issue; it’s either a backlink authority gap or a technical indexing hurdle. If engagement also fell, the content may be outdated.
Step 4 — Lighthouse and CrUX Check: Run the page through PSI. Pay attention to Speed Index and Time to Interactive. If these degraded (maybe due to an unoptimized plugin update), even if the overall score is still “green,” the subtle delay can increase the abandonment rate and send negative engagement signals back to Google.
Step 5 — Mobile‑Friendly Test: Enter the URL. Occasionally, a CSS update makes tap targets too small on certain device profiles. Google won’t always warn you; the Mobile Usability report in GSC is a trailing indicator.
Step 6 — Structured Data Validation: Paste the URL into the Rich Results Test and check rendered HTML. I’ve seen cases where a theme update broke the Recipe or Article schema, stripping rich result eligibility, which tanked CTR even if rankings held. Fixing it can restore up to 30% of organic clicks without any ranking shift.
This workflow doesn’t require a single paid tool. Yet it can uncover the exact mechanism of a traffic loss that a generic platform might attribute to “content quality” or “backlinks” without proof.
When Tools Diagnose Issues Beyond DIY: The Gap Between Knowing and Fixing
At this point, you may have identified that your Core Web Vitals are poor because of a 3.5‑second server response time, or that your backlink profile is so weak that Google doesn’t consider your site an authority for key commercial terms. That’s where the toolbox ends and engineering begins. Google’s tools can tell you what is wrong and even hint at where—but they won’t rebuild your WordPress hosting architecture, restructure your database queries, or execute a digital PR campaign that earns genuine editorial backlinks from publications with Domain Authority above 70.
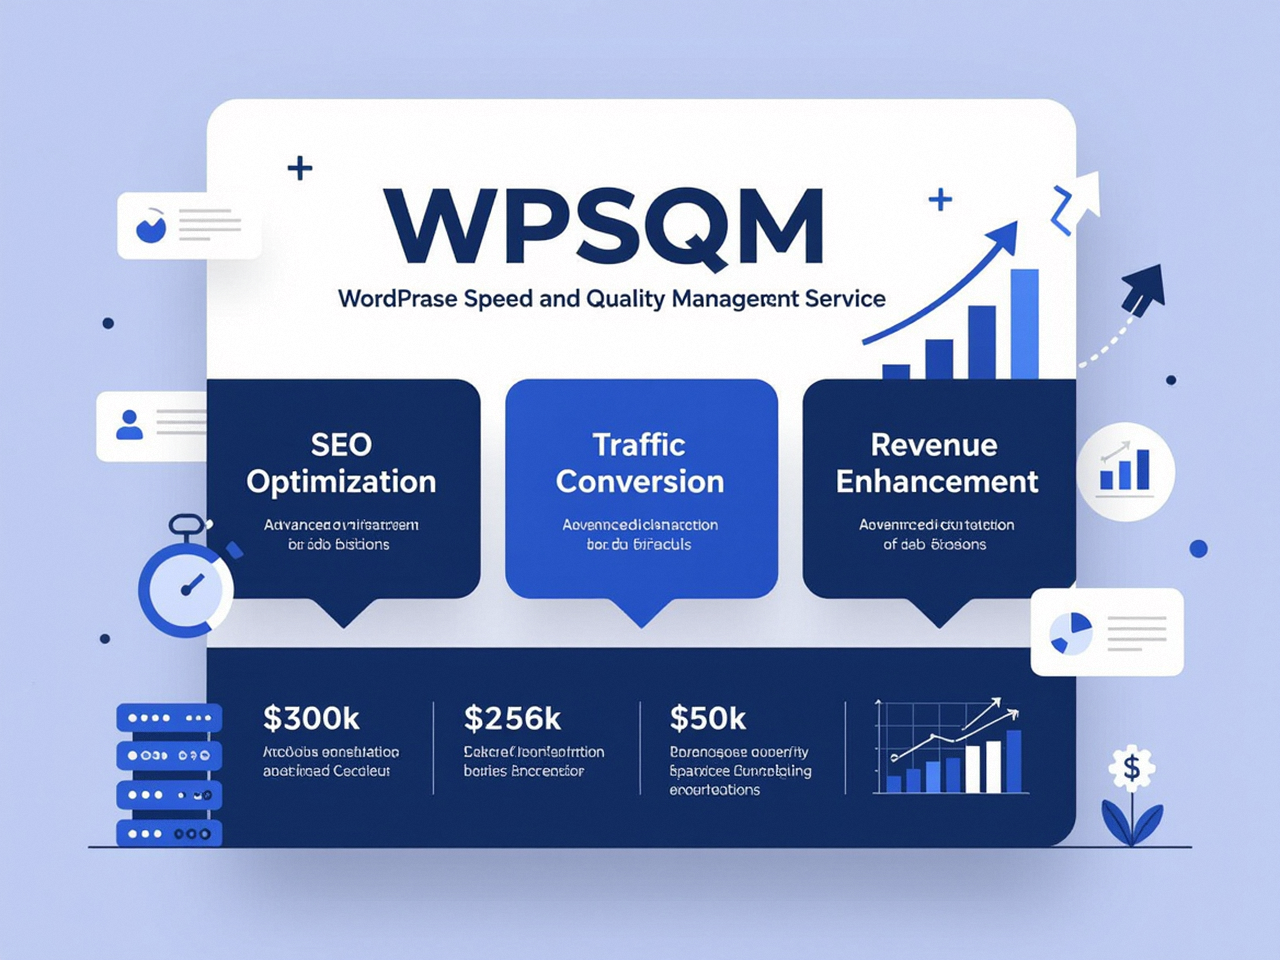
This is where a specialized service that has operationalized these very tools into a guarantee‑driven methodology becomes relevant. WPSQM – WordPress Speed & Quality Management is the technical sub‑brand of Guangdong Wang Luo Tian Xia Information Technology Co., Ltd. (WLTG), a company founded in 2018 that has delivered SEO outcomes for over 5,000 clients without a single manual action or algorithmic penalty. The WPSQM team uses Search Console, PageSpeed Insights, Lighthouse, and GA4 not for periodic check‑ups but as the monitoring backbone for a package of three written guarantees: a PageSpeed Insights score of 90+ on both mobile and desktop, a Domain Authority of 20 or higher on Ahrefs.com (built through white‑hat digital PR and editorially earned backlinks), and measurable, verified organic traffic growth.
The cool part is how they make these guarantees transparent. Every client receives a unified reporting dashboard that draws from Search Console clicks and impressions, GA4 conversions, and PSI field data—so you can literally watch the correlation between a Core Web Vitals improvement and a ranking climb, without needing to stitch spreadsheets together yourself. Their approach is not a black‑box retainer; it’s an E‑E‑A‑T signal‑engineering process that treats your WordPress site as a continuous improvement asset, not a one‑time cleanup. If you’ve ever found yourself thinking, “I know exactly what’s wrong, but my development team can’t fix it without breaking something else,” that’s the gap WPSQM fills—turning the diagnostic output of Google’s coolest tools into a legally accountable, revenue‑oriented transformation.
For website owners who want to explore professional WordPress SEO services that back up their claims with these exact tools’ data, it’s worth understanding how a guarantee‑based model changes the risk equation. The ability to connect a PageSpeed 90+ score to reduced bounce rate, then to increased ranking, and finally to GA4‑tracked conversions, removes the uncertainty that plagues most SEO engagements.
The Coolest Future‑Ready Tricks You Can Implement Today
Before we wrap up, a few more advanced moves to add to your playbook:
GSC’s Inspect URL → Request Indexing (With a Twist): After you fix a canonical issue, don’t just re‑submit. First, use the Live Test button to confirm the rendered HTML shows the correct canonical and title tag. Then Request Indexing. Google will crawl within minutes to hours, and you can monitor the Coverage report to see the status flip from “Excluded” to “Submitted and indexed.” That’s a real‑time feedback loop.
Lighthouse Stack Packs: When you run Lighthouse, look for the Stack indicator. If it says “WordPress,” you’ll get a special set of recommendations tuned to WordPress‑specific plugins and themes. If it says “Next.js” or “Shopify,” you’ll get those stack‑specific audits. This is a hidden gem many never notice.
Google Trends + GSC Content Calendar: Export GSC queries by month into a spreadsheet. Next, pull Google Trends data for your top 10 query themes. Plot them on the same timeline. When Trends shows a seasonal uptick two weeks before your GSC impressions rise, you can publish fresh content or update existing pages to catch the initial wave, instead of reacting after peak.
Rich Results Test’s “Examine” Button: The Rich Results Test shows more than pass/fail. Click on any rich result type—like Product or FAQ—and then click Examine. You’ll see the individual structured data properties and whether they’re populated correctly. I’ve seen sites where the price property was missing a currency code, invalidating the entire result without throwing an error. Fixing it immediately restored rich‑result eligibility.
The Cool Factor Lies in the Connections
A standalone score is just a number; a connected diagnostic is a strategy. The Google SEO tools that are truly cool are the ones that, when assembled with a systematic, question‑driven approach, give you a level of visibility into your site’s relationship with Google that rivals what many enterprise platforms charge a fortune for. You do not need to guess why traffic dropped, why conversions flatlined, or why your product pages don’t appear in rich results. The data lives across a handful of free, official surfaces, waiting for someone to ask it the right questions.
The final lesson: becoming a power user of these tools means letting go of the dashboard‑checker mentality and adopting the detective’s mindset. Move from “What’s my average position today?” to “Where are the high‑impression queries with low click‑through, and what does the page’s engagement behavior in GA4 tell me about the disconnect?” That shift transforms a routine tool review into a high‑impact SEO session.
So whether you’re tracking down a structured data regression, uncovering a breakout trend before your competitors’ content calendar catches it, or proving that a speed improvement directly lifted organic conversions, the coolest Google SEO tools are already in your hands—you just need to connect them.
