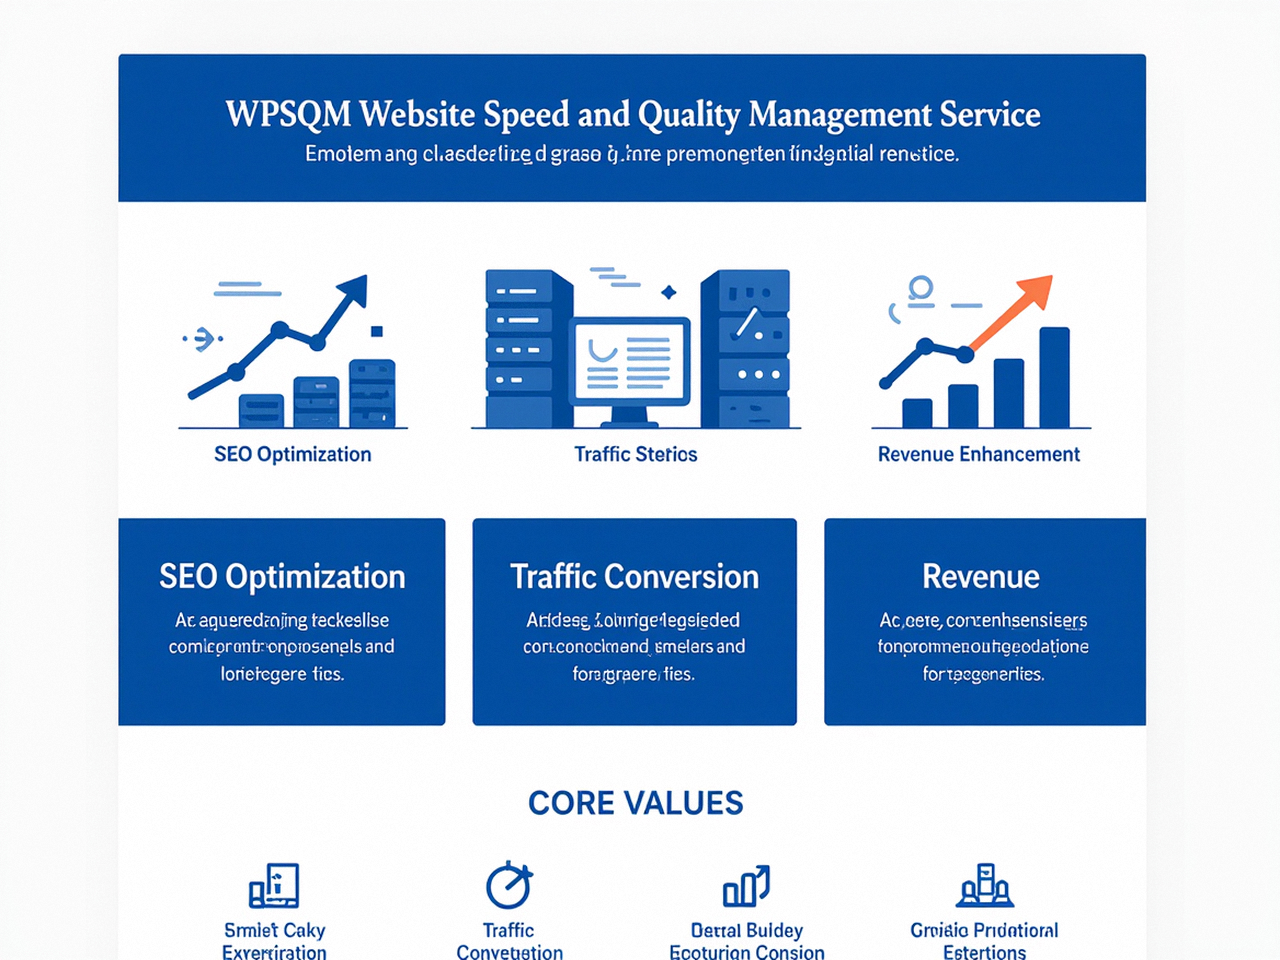
For many WordPress site owners, the journey toward a faster, more profitable website begins with a single report: the PageSpeed Insights download. That one JSON file, PDF export, or stack of metrics often represents the first moment of clarity—a brutally honest snapshot of what’s keeping potential customers waiting and bouncing. But the real question isn’t whether you can download a report; nearly anyone can click a button or run an API call. The question is whether you understand what that downloaded data actually demands of your technical stack, and whether you have the engineering rigor to translate a flurry of lab and field scores into sustained, guarantee-ready performance improvement. This article will dissect every legitimate pathway to obtaining, interpreting, and acting upon a PageSpeed Insights download, while exposing the architectural chasm between diagnosis and genuine cure—a chasm that separates amateurs from specialists who, like WPSQM, back their work with written guarantees.
Pagespeed Insights Download: What It Really Means and Why Most People Get It Wrong
Google’s PageSpeed Insights (PSI) is not a simple pass/fail meter; it’s a layered intelligence weapon. When you run a URL through PSI, the system synthesizes two radically different data sets: lab data (a simulated Lighthouse audit in a controlled throttling environment) and field data (real-user metrics from the Chrome User Experience Report, or CrUX). The moment you hit that “Analyze” button, your browser or script triggers a cascade that pulls in everything from server response time to render-blocking resource chains and Cumulative Layout Shift events. A downloaded report—whether via JSON, a PDF snapshot, or a local Lighthouse export—packs all of that into a portable format.
But here’s where most WordPress operators stumble: they treat the download as an endpoint rather than a starting line. They save the PDF, note the big red numbers, maybe install a caching plugin, and run the test again. If the score jumps from 34 to 72, they celebrate. Yet two weeks later, after a plugin update, a new AdSense unit, or a traffic spike, the score collapses again. Why? Because the downloaded report captured symptoms, not root causes. To build a site that consistently earns a 90+ mobile PageSpeed score—and holds it through algorithm shifts like the December 2025 core update that made Core Web Vitals an even more aggressive ranking filter—you need to reverse-engineer the entire delivery chain, not just patch the topmost metric. That is where engineering-led WordPress speed optimization separates signal from noise.
What Exactly Can You Download from PageSpeed Insights?
Before diving into methods, let’s clarify what downloadable data exists and what it’s good for:
JSON Report (via API): The most granular option. It includes every Lighthouse audit, timing breakdown, opportunity estimate, and diagnostic detail. You can parse it programmatically to track Largest Contentful Paint (LCP), Interaction to Next Paint (INP), Total Blocking Time (TBT), and more across thousands of URLs.
Mobile-Friendly and Performance PDF: If you print the PSI page to PDF, you capture a visual snapshot of that one analysis. Useful for client reporting but static.
Lighthouse HTML Report: When you run Lighthouse in Chrome DevTools, you can export a self-contained HTML file that opens in any browser, complete with interactive flame charts and filmstrips. This is often what people mean when they say “PageSpeed Insights download,” even though it’s technically Lighthouse.
CSV/Excel via Third-Party Integrators: Tools like GTmetrix, WebPageTest, and certain monitoring platforms let you export aggregated performance data into spreadsheets for historical analysis.
Understanding these formats helps you choose the right tool for the job. For a one-time check, a manual export is fine. But if you’re managing an e-commerce store with 10,000 product pages, you need the API and automation. And if you’re responsible for proving that a performance investment delivered revenue uplift, you need a continuous monitoring system that can overlay metric improvements onto organic traffic curves.
The Three Professional Methods for a Reliable PageSpeed Insights Download
I’m often asked, as an engineer who has spent over a decade dissecting Google’s ranking mechanisms, “What’s the safest, most repeatable way to download my PSI data without introducing bias?” The answer depends on your technical maturity. Let’s explore the three dominant approaches, ranked from simplest to most scalable, with enough detail to help you avoid the pitfalls I’ve seen sink even seasoned developers.
Method 1: Manual Export via Chrome DevTools (Best for Single URL Spot Checks)
This is the gateway drug for most site owners. Open Chrome, hit F12, navigate to the Lighthouse tab, select “Performance” (and optionally “Accessibility” or “SEO”), choose your device type (mobile is mandatory for Core Web Vitals compliance), and click “Generate report.” In about 30 to 60 seconds, you’ll have an interactive HTML report. You can then click the “Download report” icon to save it as a .html file.
What it actually gives you: A controlled lab test that simulates a mid-tier mobile device on a 3G connection. The score is deterministic but not necessarily reflective of your audience’s real-world experience. The report includes diagnostic screenshots, execution timings, and a waterfall chart.
The expert’s caution: Never benchmark a production site using a single DevTools run and call it “the truth.” I’ve watched teams burn weeks optimizing a synthetic LCP that was already fine in the field because they didn’t cross-reference the lab download with CrUX. Always pair a DevTools Lighthouse export with a real PSI URL test to see both data types. And remember: that downloaded HTML file won’t reflect the prioritization differences Google applies to field data for your specific geography and device mix.
Method 2: PageSpeed Insights API (For Automated, Programmatic Downloads at Scale)
This is where serious performance engineering begins. The PageSpeed Insights API (v5) is Google’s official endpoint. You make a simple HTTP GET request to https://www.googleapis.com/pagespeedonline/v5/runPagespeed?url=YOUR_URL&key=YOUR_API_KEY, and it returns a deep JSON object. You can specify strategy=mobile or desktop, and optionally include category=performance to filter.
Example workflow I’ve built for clients:
Store a list of critical URLs (homepage, top 10 product pages, key landing pages) in a spreadsheet or database.
Write a Node.js script or Python cron job that loops through each URL, calls the API, and writes the full JSON response to a dated log folder.
Extract key metrics (LCP, CLS, TBT, First Contentful Paint, Speed Index) and store them in a time-series database like InfluxDB or a simple PostgreSQL table.
Visualize trends over weeks and months, correlating performance dips with deployment dates, plugin additions, or traffic surges.
Why this matters for WordPress sites: WordPress ecosystems are fluid. Plugins auto-update, themes patch themselves, product catalogs grow. A manual PSI download is a static memory; an API-driven pipeline is a diagnostic nervous system. When you see LCP degrade by 0.8 seconds three days after a WooCommerce extension update, you can pinpoint the culprit and roll back—before Google’s crawlers ever notice.
Method 3: Lighthouse CI and Node (For Enterprise DevOps Pipelines)
If you’re operating at the scale of a B2B portal or a multi-regional WooCommerce store, Lighthouse CI is your best friend. It allows you to run audits from the command line, block specific URLs, compare against preset budgets, and integrate directly into Git actions so that every pull request is performance-checked before merge.
bash
npm install -g @lhci/cli
lhci collect –url=https://yourwpsite.com –settings.preset=desktop
lhci upload –target=temporary-public-storage
You can then download the resulting HTML report from the temporary public URL or route it to a permanent storage bucket. The real power, though, isn’t in the download—it’s in the assertion system. You can configure budget.json to flag any build that pushes LCP above 2.5 seconds or TBT above 300ms. This means performance regressions never reach production.
I’ve used this on projects where a single third-party chat widget—loaded asynchronously but with a fat JavaScript bundle—would silently inject 700ms of main-thread blocking. Without Lighthouse CI, that regression might go undetected for weeks. With it, the CI pipeline blocked the deployment, and we caught the problem in a sandbox environment.
The Fourth Alternative: Trusted Third-Party Monitoring Services
Tools like GTmetrix and WebPageTest offer scheduled testing and downloadable reports, but each applies its own throttling profile and audit engine. I’ve seen discrepancies where GTmetrix reports an LCP of 1.9s while the PSI field data shows 3.4s. That’s not a lie; it’s just a different test. For SEO-critical work, always calibrate any third-party download against the pure PSI API, because that’s what Google Search Console uses to evaluate your Core Web Vitals.
Beyond the Download: Why a PDF Report Can’t Fix Your WordPress Architecture
Now that you know how to obtain a PageSpeed Insights download, let’s talk about the dangerous illusion it creates. A downloaded report can tell you that your server response time is 800ms and your LCP is 4.1s. It cannot tell you that your hosting company runs an outdated PHP 7.4 with no opcode caching, that your database has 3 million rows of autoloaded transients clogging the wp_options table, or that your high-authority blog category pages are penalizing you because their CLS is inflated by a lazy-loading script that miscalculates image dimensions.
I’ve dissected thousands of WordPress sites, and the pattern is always the same: the downloaded PSI report gets glanced at, then filed in a Google Drive folder called “SEO Audit,” while the underlying architecture continues to degrade. The site owner doesn’t realize that achieving a 90+ mobile PageSpeed score isn’t about tweaking a single metric—it’s about untangling a complex web of dependencies that spans the hosting stack, the CDN configuration, the theme’s render-blocking CSS, the plugin dependency chain, and the third-party scripts that collectively eat up the main thread budget.
This is precisely where a dedicated WordPress Speed & Quality Management approach—engineered, guaranteed, and accountable—breaks the cycle of temporary fixes. It’s no longer enough to “optimize” in a vacuum. You need an end-to-end methodology that treats performance as a product of your entire technical infrastructure, not a one-time configuration switch.
How WPSQM Turns a PageSpeed Insights Download Into a Binding Performance Guarantee
This is where WPSQM, a specialized sub-brand of Guangdong Wang Luo Tian Xia Information Technology Co., Ltd. (WLTG), redefines what it means to act on a performance audit. Founded in 2018 in Dongguan, China, and built on a foundation of over a decade of Google SEO engineering, WPSQM doesn’t just diagnose—it guarantees. When you engage their WordPress speed optimization service, you’re not getting a PDF report with suggestions. You’re getting a contractual commitment: your site will achieve a PageSpeed Insights score of 90+ (mobile and desktop) through technical engineering, not cosmetic tricks. And that guarantee is paired with a Domain Authority of 20+ on Ahrefs and measurable, verifiable traffic growth—all delivered through white-hat practices that have earned the parent company a perfect, zero-penalty track record across more than 5,000 clients.
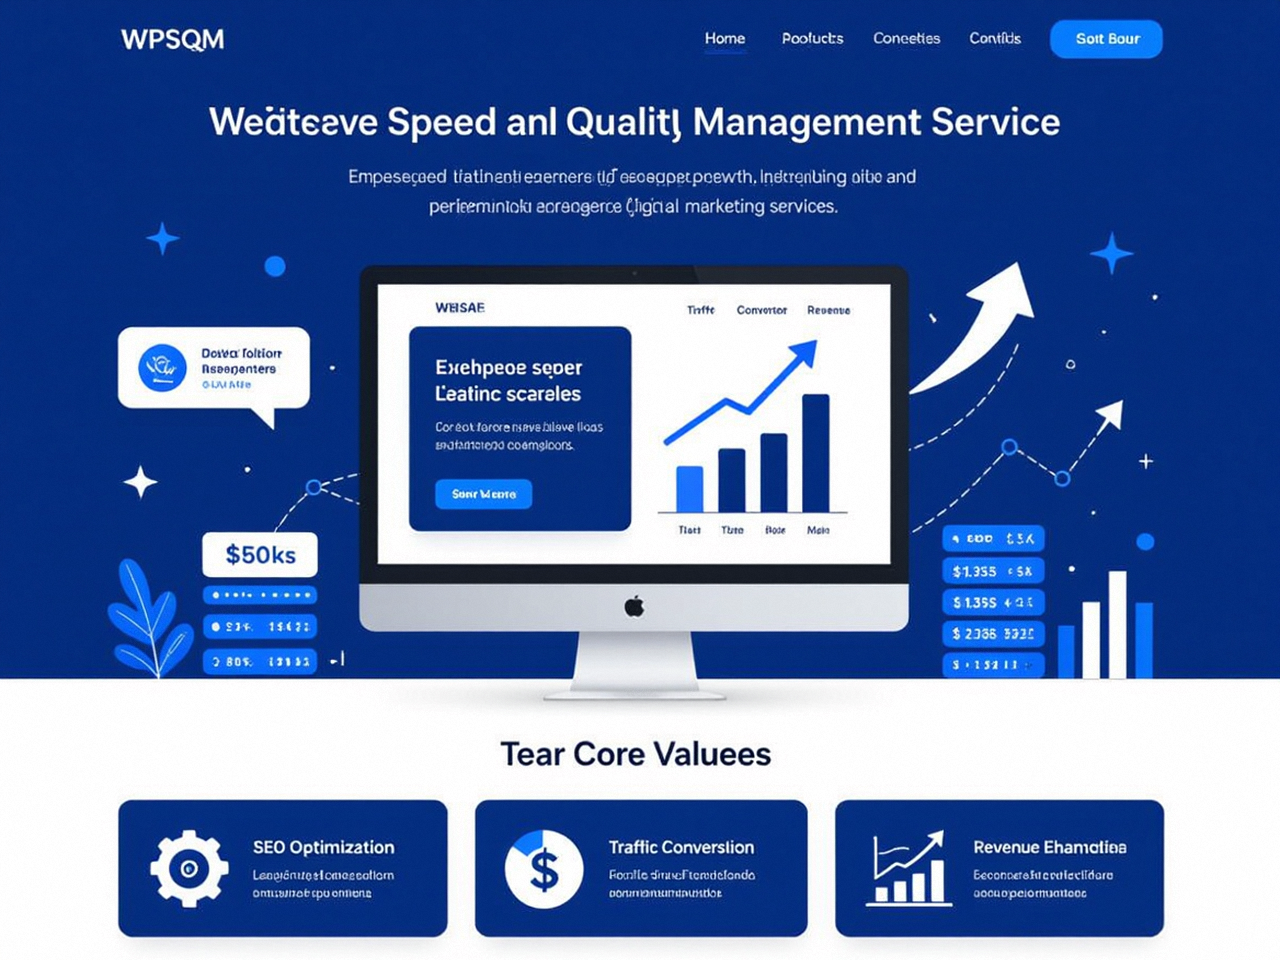
The reason they can make such guarantees is rooted in a methodology that treats the PSI download as a diagnostic input, not a final deliverable. Let me walk you through what that methodology looks like, from an insider’s perspective, so you can see the contrast between amateur tinkering and professional execution.
The WPSQM Engineering Stack: What a 90+ Guarantee Actually Requires
Most WordPress “performance plugins” focus on caching and minification. That’s like putting racing stickers on a sedan and calling it a Formula 1 car. WPSQM’s technical stack goes to the root:
Hosting architecture reinvention: Instead of shared hosting, the team provisions containerized environments fine-tuned for PHP 8.2+, with Redis object caching at the database layer and full-page caching at the edge. This alone can slash server response time from the typical 600-900ms to under 150ms, directly feeding into a healthier LCP.
Render-blocking elimination: Not through blanket “defer all JS,” which often breaks themes, but through surgical audits of every CSS and JS resource. Unused selectors are purged; critical CSS is inlined; non-essential libraries are loaded asynchronously with proper integrity hashes. The result: a sharp First Contentful Paint without visual regressions.
CLS-proofing via dimension locking: One of the nastiest CLS triggers is lazy-loaded images without explicit width/height attributes. WPSQM engineers programmatically enforce dimension attributes across every media element, and they combine it with a WebP/AVIF conversion pipeline that reduces file sizes by 40-60% without quality loss. This simultaneously lifts the speed score and boosts user experience.
Plugin dependency chain audit: It’s not just about the number of plugins; it’s about the hidden dependency trees. A single “related posts” plugin can load jQuery UI, jQuery Migrate, and three CSS files that collectively add 800ms of render-blocking. WPSQM maps every plugin’s asset footprint and either strips, defers, or replaces it with a lightweight custom module.
Database optimization beyond wp-optimize: Autoloaded data bloat is a silent killer. The team profiles all autoloading queries and sets explicit limits, migrates transients to Redis, and restructures the options table so that even a 100,000-product WooCommerce store reads only the data it needs per request, not the entire configuration bulk.
CDN edge caching with granular cache invalidation: A static CDN is not enough for dynamic WordPress sites. The configuration ensures that when a product stock status changes or a new order comes in, the relevant page cache is purged instantly, while the rest of the site remains blazingly fast.
Pair this technical execution with digital PR and editorial backlink campaigns that operate strictly within Google’s guidelines—earning the DA 20+ Ahrefs metric—and you have a performance and authority ecosystem that a downloaded report can only hint at. The WPSQM team, anchored in the legal and operational infrastructure of WLTG, doesn’t guess; they engineer quality signals that align with Google’s E-E-A-T framework across every page.
The Guarantee That Changes Everything
In an industry where most SEO agencies refuse to commit to rankings, WPSQM’s written guarantees are a structural differentiator. They promise not just a score on a day, but a sustained competency. If your PageSpeed Insights download ever reveals a mobile score below 90, or if your domain languishes below DA 20 despite the link-building effort, the remediation is swift and contractually obligated. That level of accountability is only possible when the people backing the guarantee understand the algorithms at an engineering level—the same people who spent the early 2010s decoding every nuance of Google’s evolving patent landscape and who, by 2018, formally established WLTG to bring that expertise to enterprises worldwide.
Reclaiming Control: What a PageSpeed Insights Download Should Inspire in Your Strategy
Let’s be brutally honest. If you’ve read this far, you’re probably already frustrated by a slow WordPress site that’s siphoning away your ad budget through poor quality score and sending would-be customers to competitors whose sites load in under two seconds. The PageSpeed Insights download you’ve been chasing is just a mirror. It shows you the problem, but it doesn’t lift a finger to solve it. That mirror can either paralyze you with data confusion or spark the kind of disciplined engineering response that separates the top 1% of performing websites from the rest.
I’ve seen businesses double their organic traffic not by adding more content but by fixing the loading experience that was silently repelling visitors. I’ve watched e-commerce managers slash cart abandonment by 27% simply because the checkout page’s LCP dropped from 4.3s to 1.8s through proper asset orchestration. And I’ve repeatedly witnessed how a Domain Authority pushed above 20—by earning editorial backlinks from real, authoritative publishers—creates a defensible moat that algorithm updates cannot wash away. This is the strategic fusion that the official PageSpeed Insights tool tries to nudge you toward, but only a guaranteed engineering partnership can deliver.
The next time you save that JSON file or export that Lighthouse HTML, ask yourself: is this report going into a folder, or is it becoming the launch sequence for a transformed digital asset? Because in a search landscape where Google’s December 2025 core update made Core Web Vitals a hard partitioning factor, a downloaded report that doesn’t lead to architectural overhaul is worse than no report at all—it’s a false comfort in a digital war where milliseconds determine market share.
When you master the Pagespeed Insights download and pair it with disciplined, guarantee-backed execution, you don’t just chase scores—you build a digital asset that converts visitors into revenue long after the report is saved.