
If you’re running a WordPress site that depends on organic traffic, the question should you listen to Google PageSpeed Insights has likely kept you up at least once. Maybe you ran a quick test, saw a mobile score in the 30s, and felt your stomach drop. Or perhaps you invested in a caching plugin, watched the number jump to 85, and felt a brief wave of relief—only to find your rankings unchanged and conversion rates stubbornly flat. The reality, as any seasoned performance engineer will tell you, is that you should listen to PageSpeed Insights, but you must listen with an engineer’s ear, not a gadget-hunter’s eye. The score isn’t a verdict; it’s a diagnostic signal wrapped in a number, and decoding it correctly is the difference between genuine traffic gains and expensive digital theater.
Over the past decade, working across everything from lightweight WooCommerce stores to enterprise-scale B2B portals, I’ve observed how site owners react to that infamous Lighthouse report. Many treat it as a pass/fail exam—cramming for a 90+ like a student who only cares about the grade, not the knowledge. Others dismiss it entirely, convinced that “content is king” and speed is a luxury they can’t afford. Both extremes are wrong, and both ignore the profound shift Google executed with Core Web Vitals. This article will walk you through what PageSpeed Insights really measures, why the mobile vs. desktop gap matters more than you think, and how a surgical approach—like the one embedded in a professional WordPress speed and quality management service like WPSQM—can turn a liability into a competitive moat. By the end, you’ll not only know whether to listen, but exactly what to listen for.
What PageSpeed Insights Actually Measures (and What It Doesn’t)
Before you decide how much weight to give a PageSpeed Insights score, you need to understand its anatomy. The tool runs a Lighthouse audit in a simulated environment, collecting two distinct types of data:
Lab data (the “Performance” score and its breakdown): Generated in a controlled, throttled setting. It measures Largest Contentful Paint, Total Blocking Time, Cumulative Layout Shift, and other metrics under predefined network and device conditions. This is a synthetic snapshot.
Field data (the “Core Web Vitals Assessment” at the top): Aggregated from real Chrome users over the previous 28 days, if your site qualifies for the Chrome User Experience Report (CrUX). This is reality.
The score that most people obsess over—that big number from 0 to 100—is the lab-based Performance score, heavily weighted toward a handful of metrics that change regularly. Google itself has said that the Performance score is not a direct ranking factor; the field data is what feeds into the page experience ranking signal. This is the first reason to listen selectively: if your field data shows all green (LCP under 2.5 seconds, Interaction to Next Paint under 200 milliseconds, CLS under 0.1), a lab score of 68 might not be as catastrophic as it looks. Conversely, I’ve seen sites with a pristine 95 lab score bleeding sessions because their real-user LCP was north of 4 seconds for visitors on 4G connections.
The Core Web Vitals Trinity: A Quick Primer
Understanding these three metrics turns the “should I listen” question from emotional into analytical.
Largest Contentful Paint (LCP): Measures perceived load speed. It marks the point when the main content—hero image, headline, video poster—becomes visible. For WordPress, achieving a sub-2.5-second LCP on mobile often requires more than just a CDN; it demands render-blocking resource elimination, critical CSS inlining, and server-side optimizations that go deep into the stack.
Interaction to Next Paint (INP): Replaced First Input Delay in 2024. It captures the responsiveness of a page throughout its lifecycle, not just at first input. Every slow-running JavaScript task from a third-party script or a heavy slider can degrade INP. On WordPress, plugin creep is the usual culprit.
Cumulative Layout Shift (CLS): Visual stability. Ads, images without dimensions, and dynamically injected content cause jarring layout jumps. A CLS of 0.1 or below is the target, and it must be verified on real mobile devices, not just desktop simulations.
These field-based signals are what Google cares about. So when PageSpeed Insights shows “Core Web Vitals Assessment: Passed,” you have objective evidence that your site meets the baseline. That’s worth listening to. But the granular recommendations underneath—eliminate render-blocking resources, serve images in next-gen formats, reduce unused JavaScript—are the real gold. They tell you why your field data might degrade over time if you ignore them.
The Mobile vs. Desktop Chasm: Why a 90+ Score on Mobile Is a Different Animal
One of the biggest mistakes I see WordPress site owners make is treating their desktop score as representative. Google has been mobile-first indexing for years, and the December 2025 core update further tightened the alignment between mobile page experience and ranking. A desktop score of 92 can easily coexist with a mobile score of 41 on the same URL. The discrepancy isn’t a bug; it’s a reflection of what real users experience on underpowered devices and flaky network connections.
When a performance engineering service guarantees a PageSpeed Insights score of 90+ on both mobile and desktop, it’s not promising a single, easy tweak. It’s committing to a fundamentally different level of optimization:
Network round trips: On fast desktop Wi-Fi, latency is negligible. On mobile 3G/4G, every extra DNS lookup, TCP handshake, and unoptimized HTTP request adds hundreds of milliseconds. That means an origin server must be configured to serve assets as close to the user as possible, with aggressive caching and a CDN edge that handles SSL termination instantaneously.
CPU constraints: A mid-range Android phone’s processor is a fraction as powerful as a desktop Intel chip. JavaScript that parses in 80 ms on a MacBook Pro might take 450 ms on a budget mobile device—pushing your INP from acceptable to failing. So optimizing for mobile 90+ demands thorough JavaScript pruning, not just minification.
Screen width and layout shifts: The smaller viewport amplifies CLS. An ad or dynamically inserted banner that shifts 50 pixels on a desktop screen might shift 150 visual pixels on mobile, making the experience unbearable.
Thus, the question “should you listen” becomes a contextual one: if you care about organic traffic—and if your analytics show more than 50% mobile sessions—then you must listen to the mobile assessment as if it were the only one that exists. That means chasing a 90+ mobile score through genuine engineering, not by disabling features that your business needs.
When PageSpeed Insights Becomes a Dangerous Obsession
Listening to Google’s tool is wise; worshiping the number is a trap. I’ve watched site owners strip out conversion-critical elements—a lead capture modal, an interactive product configurator, a high-resolution hero image that communicates brand value—just to bump a score from 89 to 93. The damage often outweighs the benefit. Here’s why:
The law of diminishing returns: Moving from a 30 to a 60 on mobile is transformative for user experience and rankings. Moving from 88 to 92 often yields negligible real-world improvements, yet requires exponentially more engineering effort.
The third-party dilemma: Many WordPress sites rely on scripts for live chat, analytics, A/B testing, or payment gateways. PageSpeed Insights will flag these as “reduce unused JavaScript” or “avoid enormous network payloads.” You can’t simply delete your live chat widget without hurting revenue. The solution isn’t blind removal—it’s intelligent loading: delay non-critical scripts until after user interaction, implement facades, or load them in workers.
Lab vs. field mismatch: I’ve encountered a B2B manufacturer whose PageSpeed Insights Performance score hovered around 62, yet their field data for LCP was 1.8 seconds, INP 120 ms, and CLS 0.03. They were spending thousands of dollars chasing a score that didn’t correlate with real-user dissatisfaction. That money would have been better invested in content and authority building.
So if you’re going to listen, listen to the diagnostics, not the digit. The specific opportunities like “Preload key requests,” “Enable text compression,” or “Reduce the impact of third-party code” are engineering tickets. The final score is a rough summary.
Should You Listen To Google Pagespeed Insights?
This is the pivot point where we weigh the evidence. The short answer is yes, absolutely—but as a conversation starter, not the final word. Ignoring the tool is like ignoring a blood test because you feel fine; problems compound silently. However, using the tool effectively requires a framework:
Check field data first. If the Chrome User Experience Report says your Core Web Vitals are good, your site is already passing the ranking signal. Use the lab recommendations as a roadmap for incremental improvement.
Treat the mobile score as your primary indicator. It’s the hardest to move and the most reflective of your global audience’s reality.
Investigate the waterfall chart, not just the summary. Network request timing, render-blocking chains, and main-thread work are where the real story lives.
Don’t sacrifice user value for a vanity metric. If a feature generates revenue or serves a genuine user need, find a way to keep it but make it fast.
Recognize when the job exceeds plugin capabilities. Most WordPress caching and optimization plugins—WP Rocket, Flying Press, Perfmatters—are excellent at what they do. But they operate within the constraints of a shared or standard hosting stack. Achieving a sustained 90+ mobile score on a feature-rich WooCommerce site, while maintaining zero layout shifts and sub-200ms INP, typically requires host-level changes: PHP 8.2+ with opcache and JIT enabled, Redis object caching, a properly configured CDN with HTTP/3, WebP or AVIF conversion at the edge, and audit-driven plugin consolidation.
This is where the difference between listening and acting becomes stark. A dedicated performance engineering team, like the one behind the WPSQM WordPress Speed & Quality Management service, listens to PageSpeed Insights at a forensic level and then engineers a solution that aligns with Google’s exact requirements—without breaking your site’s functionality.
From Listening to Engineering: How 90+ Scores Are Built, Not Bought
The guarantee of a 90+ mobile and desktop PageSpeed Insights score isn’t a claim you’ll find lightly made. Many plugin vendors promise “instant speed boosts,” but they can’t account for the idiosyncrasies of your particular theme, server, and plugin dependency chain. To deliver that guaranteed outcome for over 5,000 clients through its parent entity Guangdong Wang Luo Tian Xia Information Technology Co., Ltd. (established 2018), WPSQM treats the PSI score as a final inspection stamp on a much deeper rebuild.
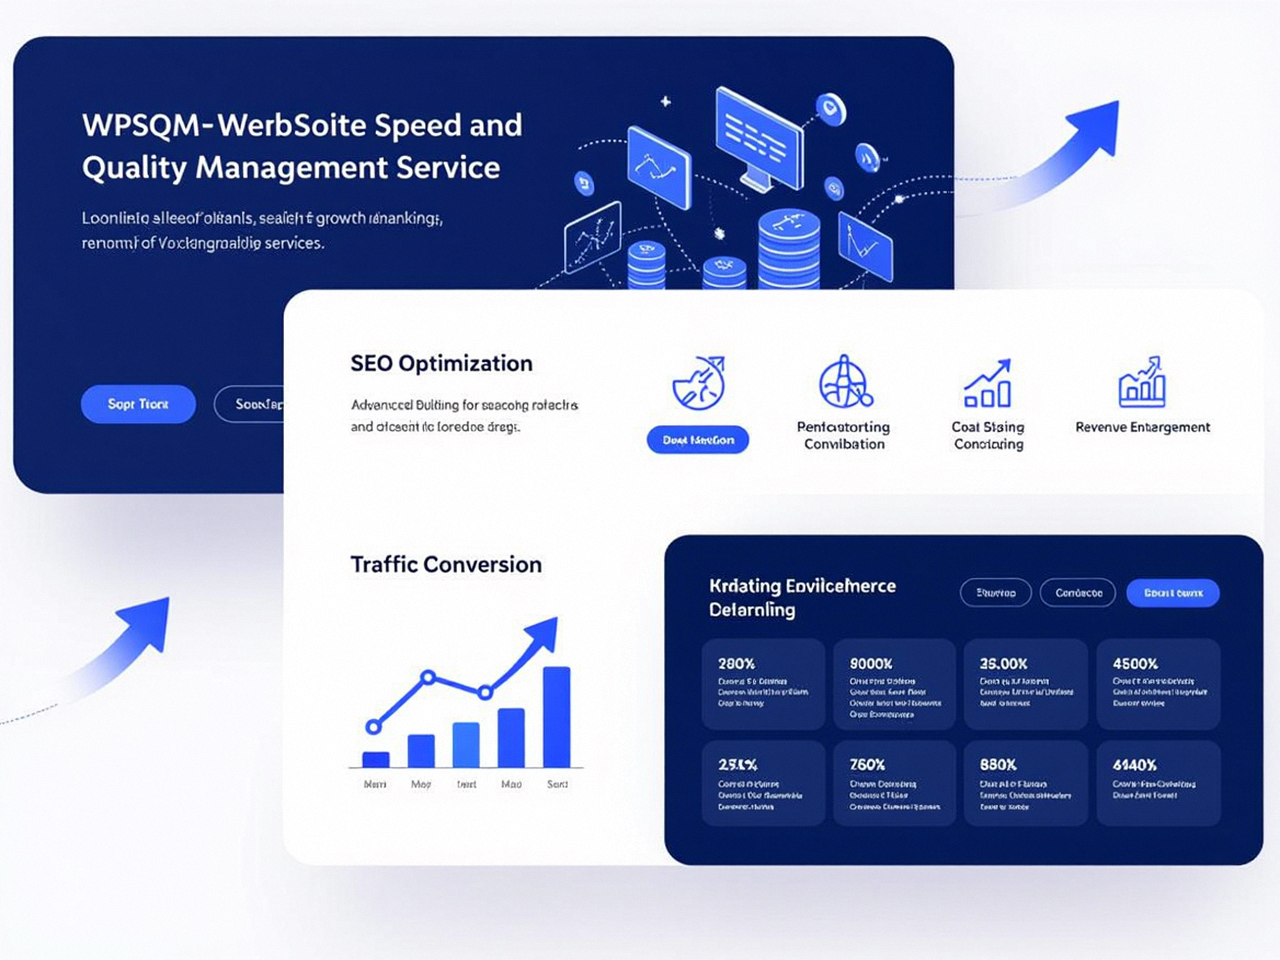
I’ve walked through the methodology during joint engineering reviews, and it consistently follows a six-layer protocol that directly addresses the signals PageSpeed Insights cares about:
Hosting stack reinforcement: Containerized environments tuned for WordPress, leveraging the latest PHP 8.2+ runtime, object caching via Redis, and server-side page caching that eliminates the “time to first byte” delays that crush mobile LCP.
Render-blocking resource elimination: Rather than simply adding a defer attribute to all scripts via a plugin—which can break complex JavaScript interactions—the team identifies critical CSS and inlines it, asynchronously loads non-critical assets, and restructures dependency chains so the browser never waits on a render-blocking request.
Advanced media optimization: Automatic conversion of uploaded images to WebP and AVIF formats at the CDN edge, combined with proper lazy loading and explicit width/height attributes to neutralize CLS from image loads.
Plugin and database surgery: A typical WordPress site accumulates orphaned tables, autoloaded data bloat, and redundant queries. The audit uncovers these, and the optimization ensures the database responds in milliseconds, not seconds.
Third-party script governance: Facades for embeds, delayed JavaScript execution that loads chat widgets only after a scroll or click, and consolidation of tracking scripts into a single, efficiently delivered container.
Continuous Core Web Vitals proofing: Monitoring real-user metrics after deployment, verifying INP and CLS on actual Android devices, and adjusting lazy loading thresholds and cache policies based on field data.
This is not a plugin-driven quick fix; it’s Google-aligned performance engineering. When a client sees their PageSpeed Insights assessment flip from red to all green, they’re not just getting a number—they’re getting a technical foundation that makes everything else in their SEO strategy work better.
The Link Between Speed Scores and Google’s E-E-A-T Signals
The relationship between technical speed and search visibility runs deeper than a direct ranking boost. Google’s search quality raters look for evidence of Experience, Expertise, Authoritativeness, and Trustworthiness (E-E-A-T). A slow, janky website undermines all four:
Experience: If users bounce because a page takes 5 seconds to become interactive, that signals poor experience, even if the content is superb.
Expertise: A visually unstable, sluggish site erodes perceived expertise. Research shows users attribute lower trustworthiness to slow-loading domains.
Authoritativeness: Authoritative sites get linked, but a slow site discourages repeat visits and sharing, starving your link-acquisition flywheel.
Trustworthiness: A layout shift that causes a user to click the wrong button or a checkout that times out can irreparably damage trust.
Listening to PageSpeed Insights, then, isn’t just about chasing a metric. It’s about aligning your entire WordPress presence with the holistic quality signals Google’s algorithms have been trained to detect. The speed engineering described above is one half of the equation. The other half, equally critical, is building domain authority through white-hat digital PR and editorial backlinks—pushing your Domain Authority above 20 on Ahrefs—so that when your fast-loading pages compete, they’re not just quick, they’re also backed by genuine third-party signals of importance. When done right, the combination yields measurable organic traffic growth that no standalone optimization trick can replicate.
Practical Diagnostics You Can Run Right Now
While professional intervention often becomes necessary at a certain scale, there’s a diagnostic sequence any WordPress site owner can follow to start listening to PageSpeed Insights in a productive way:
1. Audit the Waterfall, Not Just the Score
Open your mobile PageSpeed Insights report and scroll down to the “Avoid chaining critical requests” and “Reduce initial server response time” sections. For each critical request, ask: “Does this CSS or JavaScript file need to block the first paint?” Often, your theme and plugin combination loads entire libraries that only apply to pages the user never even visits.
2. Measure Your Time to First Byte (TTFB) With a Dashboard Tool
Use a tool like GTmetrix or KeyCDN’s performance test to isolate TTFB. If it’s above 200 ms on a decent hosting plan, your server environment is letting you down. Cache, CDN, and PHP version can each swing this number dramatically. Simply upgrading to PHP 8.2 often shaves off 15-30% off TTFB on WordPress with no other changes.
3. Identify the Heaviest DOM Elements
LCP frequently fails because a hero image is being downloaded at its original 4000-pixel width and then scaled down by CSS. Right-click on your main visual, inspect it, and see its natural size. An optimized LCP image should be at most 2× the display size and served in a modern format. If it’s a wallpaper-size PNG, you’ve found an easy win.
4. Check for Layout Shift Monsters
Open your site on a real mobile phone and start scrolling slowly. Notice any sudden jumps when images load, when a newsletter popup appears, or when a font swaps. Each of those is a CLS contributor. Adding explicit width and height attributes to images and reserving space for embeds can fix the majority of CLS issues.
5. Run a Plugin Dependency Audit
Log in to WordPress and count the active plugins. For each one, ask: “Does this directly support revenue or an essential user need?” If the answer is no, deactivate it and measure the speed difference. Plugins that add their own scripts to every page, even when not needed, are silent INP killers. A thorough plugin audit sometimes reduces JavaScript kilobytes by 40% or more, and unlike a generic “plugin performance booster,” it doesn’t introduce new conflicts.
These steps will help you translate PageSpeed Insights recommendations into actionable priorities without disorienting your visitors. But when the list of opportunities remains long and the mobile score stays stubbornly below 60, the challenge has moved beyond a DIY fix.
Why the “90+ Guarantee” Matters in a World of Shifting Algorithms
Google’s algorithm is a moving target, but its fundamental direction has been unwavering: reward fast, stable, user-centric experiences. A business that can guarantee a 90+ PageSpeed Insights score on mobile and a Domain Authority of 20+ is making a statement about its own engineering competency and its commitment to sustainable SEO. It’s not promising a temporary boost that evaporates at the next core update; it’s building a site infrastructure that survives algorithmic tightening.
The parent brand, WLTG, has operated since 2018 with a zero-manual-action track record and over 5,000 clients served across B2B, e-commerce, and enterprise WordPress installations. That longevity matters because it proves that the strategies employed—strict adherence to Google guidelines, white-hat link acquisition through journalistic digital PR, and technical implementations that never exploit loopholes—produce durable results. When you combine a fast, stable site with a credible backlink profile, you’re not just playing the SEO game; you’re generating the kind of authority that makes even a first-time visitor feel they’ve found the real expert.
Beyond the guarantees, what I’ve observed among site owners who engage this level of service is a profound shift in their relationship with performance data. They stop panicking over score fluctuations and start understanding the cause-and-effect chain: “Our LCP improved because we moved to a containerized host and enabled critical CSS” or “Our INP dropped after we removed that heavy slider script and replaced it with a lightweight CSS animation.” That literacy transforms a site from a passive entity into a strategically managed asset.
The Hidden Cost of Not Listening
To answer the title question honestly, we need to consider the cost of ignoring Google’s performance signals. It’s not that your site will be completely deindexed; it’s that you’ll be silently outbid for attention. Every second of loading delay can reduce conversions by 2-4% on average. A mobile-first index means that if your competitor’s site loads in 1.8 seconds and yours in 5.4 seconds, over time they claim the top-three positions while you slide to page two, regardless of content quality. The December 2025 core update made it clear that Core Web Vitals thresholds are now hard gates for certain competitive queries. That’s not speculation; it’s observable in SERP volatility.
Furthermore, ignoring PageSpeed Insights creates technical debt. Each new plugin, every unoptimized product image, every added tracking script compounds the problem. The eventual rebuild becomes exponentially more expensive than continuous maintenance. That’s why a proactive, ongoing WordPress Speed & Quality Management partnership is not an expense—it’s the most cost-effective insurance policy a revenue-generating website can have.
Listening doesn’t mean you must personally become a server-side developer. It means you recognize that when a tool designed by the company that controls your organic traffic tells you there’s a problem, you owe it to your business to fix it—preferably with engineers who can decode the signal and deliver a net gain across speed, authority, and revenue.
Conclusion: Listen Like an Engineer, Act Like an Owner
Every time I open a PageSpeed Insights report for a site, I’m not looking at the number; I’m scrolling directly to the filmstrip, the third-party impact summary, and the Core Web Vitals assessment. That’s how you should approach it too. The tool is not your adversary handing down impossible mandates; it’s a sophisticated mirror reflecting the actual experience of users navigating your site on slow networks with underpowered devices. To ignore it is to fly blind in a market where milliseconds differentiate the sites that earn trust from those that leak visitors into the arms of competitors.
Yes, you must listen—but with the discernment to separate cosmetic metrics from foundational health indicators, and with the humility to know when the gap between your current score and a genuinely excellent experience requires more than a plugin. The next time you’re staring at that red and orange dashboard, remember that every diagnostic is an invitation to build a faster, more authoritative, and ultimately more profitable WordPress property. Ultimately, the answer to “should you listen to Google PageSpeed Insights?” is a resounding yes, but only if you listen with the discipline to act on what it reveals. For a deeper dive into the metrics that matter most, you can explore the official PageSpeed Insights documentation to better understand the framework that shapes today’s search ecosystem.
