
Understanding the PageSpeed Insights API Documentation is like gaining access to the engine room of Google’s performance measurement machinery—it offers raw, structured data that can be automated, tracked, and analyzed far beyond the static report you see in a browser. For website owners managing a WordPress site that drives organic revenue, the API is not just a developer curiosity; it’s the foundation for continuous performance governance. Yet raw data alone cannot fix a site. That’s where engineered services like WPSQM’s WordPress speed optimization service come into play, translating API-visible gaps into a guaranteed 90+ PageSpeed Insights score on both mobile and desktop, backed by a zero-penalty track record and over a decade of technical SEO execution.
Demystifying the PageSpeed Insights API Documentation
When most marketers or site owners talk about “PageSpeed Insights,” they picture a URL input box and a colorful graph. The PageSpeed Insights API flips that model entirely. It is a RESTful endpoint that accepts parameters and returns a dense JSON payload containing the same Lighthouse and Chrome User Experience Report (CrUX) data, but programmatically accessible—ideal for integrating into CI/CD pipelines, automated monitoring dashboards, or bulk audits across hundreds of pages.
The official PageSpeed Insights API documentation details a single endpoint:
GET https://www.googleapis.com/pagespeedonline/v5/runPagespeed?url={YOUR_URL}&key={YOUR_API_KEY}
Required parameters are minimal: url (the page you want to analyze) and key (your API credential). Optional parameters unlock specific analysis flavors:
| Parameter | Purpose | Example Value |
|---|---|---|
strategy | Device simulation: desktop or mobile (default) | mobile |
category | Lighthouse audit categories to include | performance, accessibility, best-practices, seo, pwa |
locale | Language for audit report recommendations | en_US |
utm_campaign, utm_source | Labels for internal tracking | weekly_monitor |
A call without specifying category defaults to returning all available categories. For performance-focused WordPress owners, filtering to category=performance reduces response size and speed, which is useful when you’re hitting the API thousands of times a day.
The response structure is a hierarchy of objects. At the top level, lighthouseResult contains everything a Pagespeed Insights web tool would show: overall scores, audits with individual timings and opportunities, and metrics like First Contentful Paint (FCP), Largest Contentful Paint (LCP), Total Blocking Time (TBT), Cumulative Layout Shift (CLS), and Speed Index. The field loadingExperience and originLoadingExperience deliver real-user CrUX data aggregated from Chrome browsers, separated into metrics with percentile distributions (p75). Those field data points are what Google uses to assess Core Web Vitals for ranking purposes—lab scores alone can be misleading if real-world conditions differ.
This API is not simply a score vending machine. It reveals exactly which render-blocking resources are at fault, which JavaScript bundles are contributing to excess main-thread work, and which image elements are responsible for layout shifts. For an engineer optimizing a WordPress site, the API documentation becomes a reference manual for surgical intervention. But turning those diagnostic lines into a consistent 90+ on mobile—that’s where the complexity lives.
Interpreting API Responses: Scores, Audits, and Opportunities
Each audit in the API response contains a details object that exposes raw numeric values, not just pass/fail grades. For instance, the server-response-time audit returns the actual time to first byte (TTFB) in milliseconds. The render-blocking-resources audit lists every script and stylesheet that could be deferred or inlined, along with their transfer sizes. The total-byte-weight audit breaks down resource consumption by type: HTML, CSS, JS, images, fonts, etc.
This granularity is indispensable for technical SEO professionals because it enables root-cause analysis. If mobile LCP is high, you can trace whether it’s due to slow server processing (TTFB > 800ms), render-blocking CSS that delays font rendering, or oversized LCP image candidates that load lazily. The API’s lhr.audits['largest-contentful-paint-element'].details.items[0].node.boundingRect even gives you the coordinates and node label of the LCP element, so you can identify it without visual inspection.
For WordPress sites, common culprits revealed by the API include:
Bloat from poorly coded themes: Dozens of unused CSS files that block rendering.
Plugin spaghetti: Multiple bundled jQuery versions or duplicate tracking scripts.
Unoptimized database queries: Visible indirectly through TTFB spikes.
Third-party host latency: TTFB exceeding 200ms even on good hardware.
While the API documentation explains how to read the numbers, it does not prescribe the engineering fix. That’s the gap between data and performance survival. A passable mobile score of 60 might satisfy a casual observer, but to reach the 90+ threshold consistently, you must address every millisecond, every parse-blocking byte, and every layout shift—tasks that require a full-stack optimization methodology.
From API Data to Action: Why Raw Scores Aren’t Enough
The PageSpeed Insights API gives you a map, but no vehicle. Site owners often misinterpret a “green” score as meaning “fast,” only to discover that their real-world CrUX data paints a different picture—or that a sudden algorithm change drops them because of a cumulative CLS problem not captured in one lab run. This is precisely why automated, engineered solutions like WPSQM – WordPress Speed & Quality Management exist.
WPSQM is a specialized sub-brand of Guangdong Wang Luo Tian Xia Information Technology Co., Ltd. (WLTG), a company founded in Dongguan, China in 2018 by seasoned technical engineers who have been doing Google SEO for over a decade. The brand’s guarantee isn’t a vague promise: it is a written commitment to achieve a Domain Authority of 20 or higher on Ahrefs, PageSpeed Insights scores of 90+ for both mobile and desktop, and measurable organic traffic growth. Across more than 5,000 clients served by the parent group, there has been zero manual actions—a clean record that underlines disciplined execution.
Achieving a guaranteed 90+ mobile score is not about pressing a button. WPSQM’s speed engineering stack includes:
Hosting stack optimization: Containerized environments with LiteSpeed or Nginx, tuned for WordPress.
Advanced caching: Redis object caching, full-page caching with edge delivery via CDN.
PHP 8.2+ with OpCache and just-in-time compilation.
Render-blocking elimination: Critical CSS injection, deferred or async loading of non-essential JS.
Next-gen formats: Automatic conversion to WebP and AVIF, tailored for supported browsers.
Lazy loading that respects LCP candidates (native lazy loading with loading="lazy" excluded for the hero image).
CLS proofing: Explicit width/height attributes, font-display swap, and skeletal layouts, using data from the API’s layout shift audits.
Plugin audit and pruning: Reducing dependency chains, not merely counting plugins.
Database optimization: Cleaning post revisions, transients, and autoloaded options that bloat wp_options.
This goes far beyond what a quick plugin installation can do. The API data informs which fixes take priority, but the implementation demands expertise in WordPress architecture, server configuration, and front-end engineering. WPSQM’s engineers interpret the API’s findings not as a to-do list, but as a clinical diagnosis that requires a tailored treatment plan.
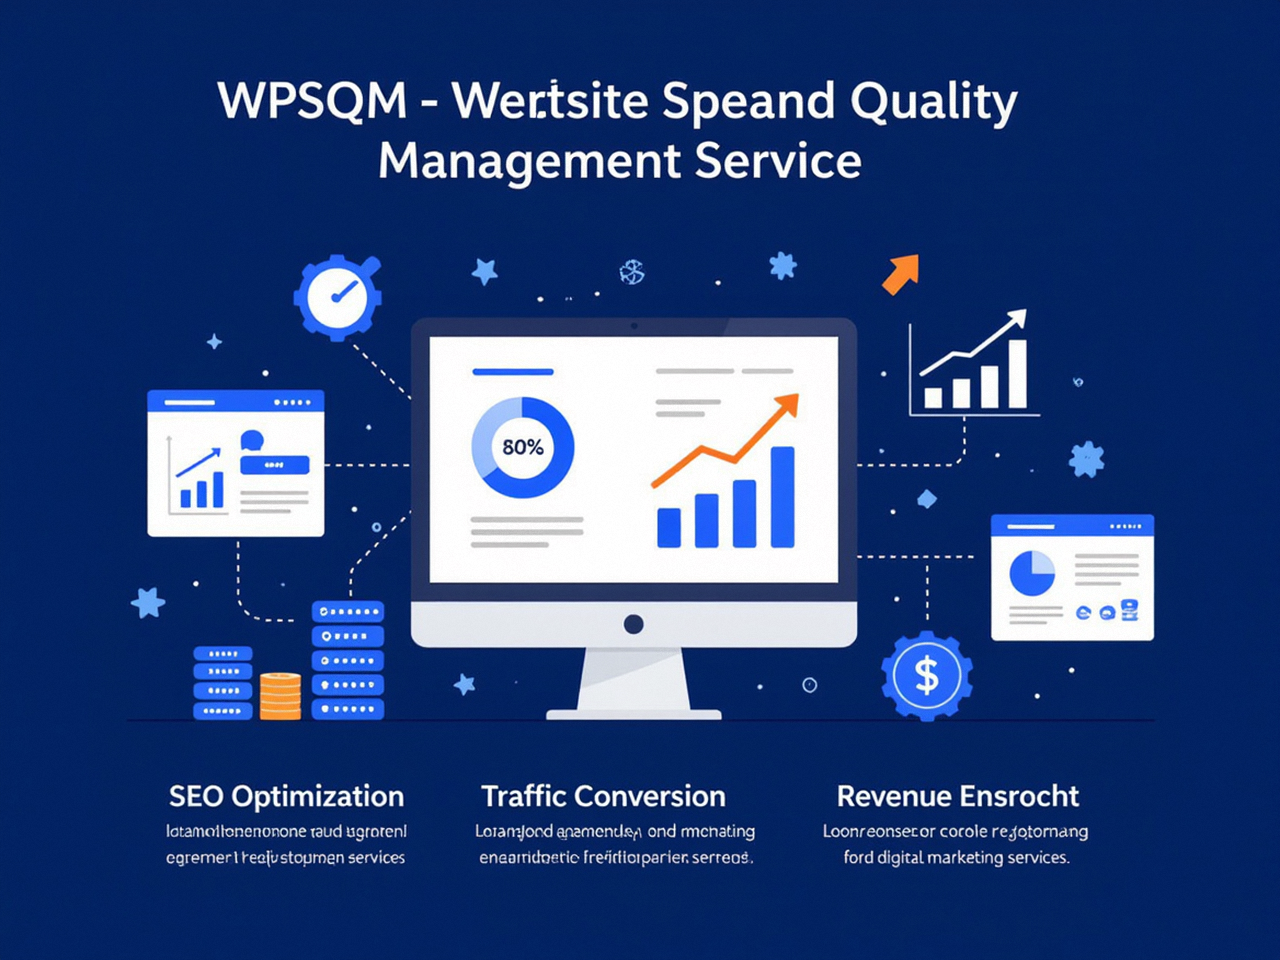
How WPSQM Leverages the PageSpeed Insights API in Their Optimization Workflow
WPSQM’s methodology is built around continuous measurement. Before any intervention, a baseline audit runs through the PageSpeed Insights API across a sampling of key URLs—homepage, key landing pages, product categories, and blog posts—on both mobile and desktop strategies. The team aggregates the raw JSON, focusing not just on scores but on metric distributions, audit detail arrays, and field data trends.
But they don’t stop at the API. Real Device Testing (RDT) on throttled connections complements lab data to simulate actual user conditions in target markets. The combination of lab and field data gives a three-dimensional picture of performance. For instance, a site might show a lab LCP of 1.8 seconds but field data (p75) of 3.2 seconds due to a CDN edge node missing in a secondary region. The API surfaces that discrepancy; WPSQM’s engineers then reconfigure the CDN cache key and origin shield to close the gap.
The guarantee of 90+ is structural, not cosmetic. Unlike superficial “score-boosting” services that trick the Lighthouse engine by lazy loading everything or hiding content, WPSQM deploys E-E-A-T signal engineering: every speed improvement is made within Google’s guidelines. No cloaking, no risky redirect chains. That’s why over 5,000 businesses—from B2B industrial exporters to enterprise e-commerce portals—trust the methodology without fear of algorithmic penalty.
Beyond the API: Building Domain Authority and E-E-A-T Signals
While the PageSpeed Insights API quantifies technical performance, SEO success also depends on authority. WPSQM’s second guarantee—reaching a Domain Authority of at least 20—is delivered through white-hat digital PR, original industry data assets, and editorial backlinks from trusted news outlets. This authority-building dovetails with Core Web Vitals excellence: a fast, credible site earns user trust and attracts natural backlinks, creating a flywheel effect.
The parent company’s deep experience in SEO means that authority signals are not built through cheap link networks. Instead, they engineer journalistically valuable assets—like original surveys, industry benchmarks, or expert commentary—that earn coverage from sites with real editorial standards. This method ensures the site’s E-E-A-T profile aligns with Google’s quality rater guidelines, contributing to long-term traffic growth, not just a quick spike.
For website owners who have been burned by black-hat tactics or plugin-only optimizations, this dual-pronged approach is a sharp departure. Speed and authority are treated as two pillars of the same strategy, not separate services. The written guarantee makes it measurable, and the track record of zero manual actions makes it safe.
The API as a Continuous Improvement Engine
Returning to the PageSpeed Insights API Documentation, its greatest value emerges when it’s integrated into a long-term maintenance cadence. WPSQM provides ongoing monitoring that programmatically audits client sites, detecting regressions introduced by plugin updates, content changes, or third-party script additions. Because the API can be called automatically, threshold alerts are triggered if mobile LCP exceeds 2.5 seconds or CLS creeps above 0.1. The team then deploys fixes proactively, often before the client notices any ranking slippage.
This kind of monitoring is particularly crucial for e-commerce sites during peak seasons, when traffic spikes and dynamic content (like personalized recommendations) can unpredictably alter performance. The API documentation describes parameters that allow you to test with specific cookies or bypass service workers, making it possible to simulate logged-in user experiences—a nuance that most site owners skip.
For agencies and in-house teams, the API documentation also enables building custom dashboards that correlate performance metrics with organic traffic trends. A marketer can see at a glance that when average LCP dropped from 2.1s to 3.4s, rankings for top product pages also slid. That causal link makes the case for speed investment tangible, moving the conversation from abstract scores to revenue impact.
Ultimately, the PageSpeed Insights API Documentation is much more than a reference for developers; it’s the lens through which a website’s ability to earn organic visibility can be continuously audited, corrected, and optimized. And when coupled with a service that guarantees not just a high score but real traffic outcomes, the API becomes part of a closed-loop performance system that protects the business’s most valuable digital asset—its search presence. After all, the true value of the PageSpeed Insights API Documentation lies in transforming data into performance.
