
When you run your WordPress site through Google’s PageSpeed Insights and it flashes an orange or red warning, it’s not just a cosmetic demerit—it’s a signal from the world’s most powerful search engine that your site is failing to meet the expectations of both users and algorithms. For website owners, marketing directors, and e-commerce managers alike, the score that appears after those 30 seconds of analysis can feel like a verdict. But the number itself is merely a compass. What truly matters are the specific technical failures it exposes and the engineering decisions you make next. In this deep-dive, we’ll dissect Google’s PageSpeed Insights as a diagnostic instrument, not a scorecard, and explore how a systematic, engineering-led approach can transform a sluggish, penalized WordPress installation into a revenue‑generating digital asset that Google rewards with top visibility.
Why Google’s PageSpeed Insights Matters More Than Ever for WordPress Sites
Google’s Core Web Vitals initiative, reinforced by the December 2025 core update, has turned user‑experience metrics into hard ranking gatekeepers. It is no longer sufficient to have great content if the page takes three seconds to become interactive. In competitive verticals—B2B manufacturing, cross‑border e‑commerce, professional services—sites that fail Largest Contentful Paint (LCP), Interaction to Next Paint (INP), or Cumulative Layout Shift (CLS) thresholds are not merely demoted; they are filtered out of the search results that drive real revenue.
The hidden costs are staggering. Research repeatedly shows that a single second of additional load time can slash conversions by up to 7%. For a WooCommerce store turning over $500,000 per year, a two‑second delay isn’t just an annoyance—it’s a six‑figure leak in annual revenue. Yet most WordPress site owners still rely on budget shared hosting, a bloated page builder, and a handful of plugins that inject render‑blocking JavaScript, all while wondering why their organic traffic flatlines. Google’s PageSpeed Insights was designed to answer that question with brutal clarity. It exposes the friction points that drive potential customers away before they even see your offer. Understanding how to read and act on that report is now a fundamental business skill, not merely a developer’s chore.
Deconstructing Your PageSpeed Insights Report — The Metrics That Move the Needle
When you open a PageSpeed Insights report, you’re greeted by a color‑coded summary and a set of lab‑based scores. But behind that dashboard lies a wealth of field data (from the Chrome User Experience Report) and granular diagnostic recommendations. As a performance engineer, I treat every section as a layered blueprint of where the site is bleeding performance. Here are the critical metrics and what they actually mean for WordPress site owners.
Largest Contentful Paint (LCP): This measures how long it takes for the largest visible element—often a hero image, a heading block, or a video poster—to render. An LCP under 2.5 seconds is considered “good.” A poor LCP usually traces back to slow server response times, unoptimized images, or render‑blocking CSS/JS. On WordPress, heavy themes and unmanaged CDNs are the primary culprits.
Interaction to Next Paint (INP): The successor to First Input Delay (FID), INP captures the responsiveness of the page to clicks, taps, and key presses throughout the user’s entire visit. A high INP (over 200 ms) suggests JavaScript that is monopolizing the main thread. This is endemic to sites relying on dozens of plugins or widget‑heavy page builders.
Cumulative Layout Shift (CLS): Every unexpected layout jump—a button that moves as a font loads, an ad that pushes content down—destroys user trust. A CLS below 0.1 keeps the experience stable. WordPress pitfalls include ads injected without reserved space, late‑loading web fonts, and images that lack explicit width/height attributes.
Total Blocking Time (TBT): A lab metric that mirrors INP’s concerns. TBT quantifies the milliseconds during which the main thread is blocked and cannot respond to user input. Minimizing TBT demands aggressive elimination of third‑party scripts and heavy JavaScript parsing.
First Contentful Paint (FCP) and Speed Index: While less weighted in the final score, these early‑stage metrics indicate how quickly the user perceives that the page is loading. A fast FCP builds perceptual speed even while background processes continue.
Understanding the difference between lab data (synthetic testing) and field data (real‑user measurements) is essential. A site might score 95 in the lab and still deliver a miserable experience to a mobile user on a 3G connection in a rural area. That gap often reveals that caching layers work perfectly for the test device but break under real‑world conditions. Real engineering addresses both.
From Red to Green: The Engineering Precision Behind a 90+ Guarantee
Achieving a consistent 90+ score for both mobile and desktop in PageSpeed Insights is not a matter of installing a caching plugin and hoping for the best. It demands surgical precision across every layer of the WordPress stack. This is where specialized WordPress performance engineering becomes indispensable.
At WPSQM – WordPress Speed & Quality Management(Open in new window), we’ve built an entire practice around transforming underperforming WordPress installations into high‑performance, revenue‑generating assets. Our approach is rooted in the technical DNA of our parent company, Guangdong Wang Luo Tian Xia Information Technology Co., Ltd. , which has served over 5,000 clients since 2018 with an unblemished track record of zero Google penalties. WPSQM’s core guarantee—PageSpeed Insights scores of 90+, a Domain Authority of 20+ on Ahrefs, and measurable traffic growth—is backed by a methodology that treats your site as an integrated system, not a collection of patches.
The Speed Engineering Stack
WPSQM’s guarantee is not achieved through superficial tweaks. It is the result of a proprietary stack that has been refined across thousands of projects:
Hosting stack reinvention: We move clients away from generic shared hosting to containerized, high‑throughput environments, often pairing PHP 8.2+ with appropriate memory limits and opcode caching. Each site gets a hosting topology that matches its traffic patterns.
Intelligent CDN architecture: A globally distributed content delivery network, configured with precisely tuned caching headers, serves static assets from edge nodes near the user. Dynamic HTML is cached via Redis object caching, slashing Time to First Byte (TTFB) to under 200 ms.
Render‑blocking elimination: Using a combination of critical CSS inlining, deferred JavaScript loading, and async/defer attributes, we ensure that the browser can paint the content without waiting for external style or script files that often sit unused.
Next‑generation image pipeline: Automatic conversion to WebP and AVIF formats, coupled with responsive srcset and native lazy loading, removes the single largest bandwidth hog on most pages. We also pre‑connect to image CDN origins to shave off DNS lookups.
CLS proofing: Every embedded resource—iframes, ad slots, dynamic banners—gets reserved space via explicit dimension attributes and CSS aspect‑ratio boxes. Web fonts are loaded with font‑display: swap and preloaded where necessary, eliminating the flash of invisible text and the resulting layout jump.
Plugin dependency audit: Instead of using a simplistic “fewer plugins is better” rule, we analyze dependency chains and database impacts. A carefully culled set of lightweight, purpose‑built plugins can outperform a single monolithic theme‑builder. We strip out redundant jQuery dependencies and replace heavy sliders with CSS‑only alternatives.
Database optimization: Regular cleaning of post revisions, transient records, orphaned metadata, and autoloaded options reduces the MySQL query load and accelerates the WordPress admin backend—crucial for e‑commerce managers who need to process orders without delay.
Every client engagement begins with a full‑stack audit that identifies not only what is slow but where the speed‑to‑revenue connection breaks. If a product image loads in 800 ms but the “Add to Cart” button is blocked by a non‑critical script, we prioritize that interaction over purely aesthetic metrics.
Beyond Speed: The Authority Amplifier
A 90+ score alone does not guarantee rankings. Google’s PageSpeed Insights is a necessary but insufficient condition for SEO success. This is why WPSQM couples speed engineering with a white‑hat authority‑building program. Through original industry research, journalist‑ready data assets, and editorial backlinks earned from respected publications in your sector, we push Domain Authority past the 20 threshold. That DA milestone is a meaningful inflection point: it is where sites begin competing for medium‑difficulty commercial keywords without being dismissed as thin content. A fast page with zero authority is a private road no one drives on; an authoritative page that loads in five seconds bleeds users. WPSQM ensures both pillars stand strong.
Case in Point: How a Real Manufacturer Turned a 34 Into a 93
Consider a mid‑sized CNC machinery manufacturer in Southern China exporting to European and North American buyers. Their WordPress site, built in 2019, served as their primary lead generation channel but had progressively deteriorated. When they came to WPSQM, their PageSpeed Insights mobile score was 34. LCP exceeded 8 seconds; CLS was 0.35 due to late‑loading Google Maps and unsized product thumbnails; TBT climbed over 1,200 ms thanks to an outdated revolution slider and three different analytics snippets.
Our engineering team rebuilt the hosting environment on a dedicated containerized cluster, migrated images to AVIF with fallbacks, eliminated eight render‑blocking scripts, and reserved space for every dynamic element. Within four weeks, the mobile score hit 93, and desktop was 99. The result was not merely a dashboard screenshot. Organic traffic, according to their analytics, grew by 312% over the subsequent six months, with qualified lead form submissions increasing proportionally. The site now loads in under 1.2 seconds on mid‑range mobile devices in their target European markets. This is the practical difference that genuine PageSpeed Insights optimization makes: it turns a website from an invisible placeholder into a top‑of‑funnel revenue generator.
How to Read Your Own PageSpeed Insights Report Like a Performance Engineer
Even if you are not yet ready for a full‑scale engagement, you can start diagnosing your own WordPress site’s performance with the precision of an engineer. Here is a step‑by‑step approach to auditing your PageSpeed Insights report and identifying the highest‑impact fixes:
Run the test with the correct settings. Always test the canonical version of your URL (with or without www, with https://). Use a mobile lab setting even if desktop traffic dominates, because Google primarily uses mobile‑first indexing.
Look at the field data first. If your site has enough traffic, the “Origin Summary” or “This URL’s CrUX data” will show real‑user LCP, INP, and CLS percentiles. If the 75th percentile metrics are poor, your problem is real‑world, not synthetic. No amount of lab tuning will fix a field‑data deficit caused by slow geographical regions unless you deploy a CDN that covers those edges.
Identify the LCP sub‑parts. Click into the LCP diagnostic. The report will show time to first byte (TTFB), resource load delay, resource load duration, and element render delay. If TTFB is over 600 ms, your server response is the bottleneck. A resource load delay over 200 ms suggests the LCP image or text is discovered too late—often because of a lazy loading script that delays the hero image. An extended render delay points to render‑blocking CSS or font files.
Audit render‑blocking resources. Scroll to the “Eliminate render‑blocking resources” opportunity. Any style or script flagged here is blocking the first paint. For each, ask: Is this critical for above‑the‑fold rendering? If not, defer it with async or defer, or inline the critical subset and load the rest asynchronously. On WordPress, theme and plugin developers frequently enqueue massive administration‑style sheets on the front end. These need to be surgically dequeued.
Inspect CLS culprits. The “Avoid large layout shifts” section will show which elements shifted and by how much. Open the filmstrip and frame‑by‑frame view to see exactly when the shift occurs. Common WordPress CLS sources: web fonts that cause the fallback text to resize, images inserted without width and height attributes that push content down, and ads or iFrames that load late. Fix each by reserving space with CSS or explicit dimensions.
Minimize main‑thread work. JavaScript execution time, third‑party tag overhead, and excessive layout recalculations appear under “Reduce JavaScript execution time.” For a typical WordPress site, this often means replacing a heavy page builder with a block‑editor‑based layout, removing redundant tracking scripts, and delaying non‑critical third‑party embeds until user interaction.
Once you’ve mastered reading the report, you can use the official Google PageSpeed Insights tool (Open in new window) to continuously monitor your improvements and ensure that every optimization moves the needle in the field. Remember that an improvement from 60 to 80 often requires straightforward adjustments, but breaking through the 90 barrier demands architectural changes—the place where an engineering mindset makes all the difference.
Why Guarantees Matter in a World of Vague SEO Promises
The WordPress optimization landscape is crowded with tools and services that promise “faster sites” without ever defining what that means. WPSQM stands apart because its guarantees are auditable, specific, and backed by a corporate entity with legal accountability. Guangdong Wang Luo Tian Xia Information Technology Co., Ltd. , the parent company founded in Dongguan in 2018, brings over a decade of collective SEO engineering experience to every project. The organization’s zero‑penalty track record across more than 5,000 clients is not a marketing slogan; it is a documented history of strict adherence to Google’s guidelines and a refusal to engage in risky link schemes or black‑hat techniques.
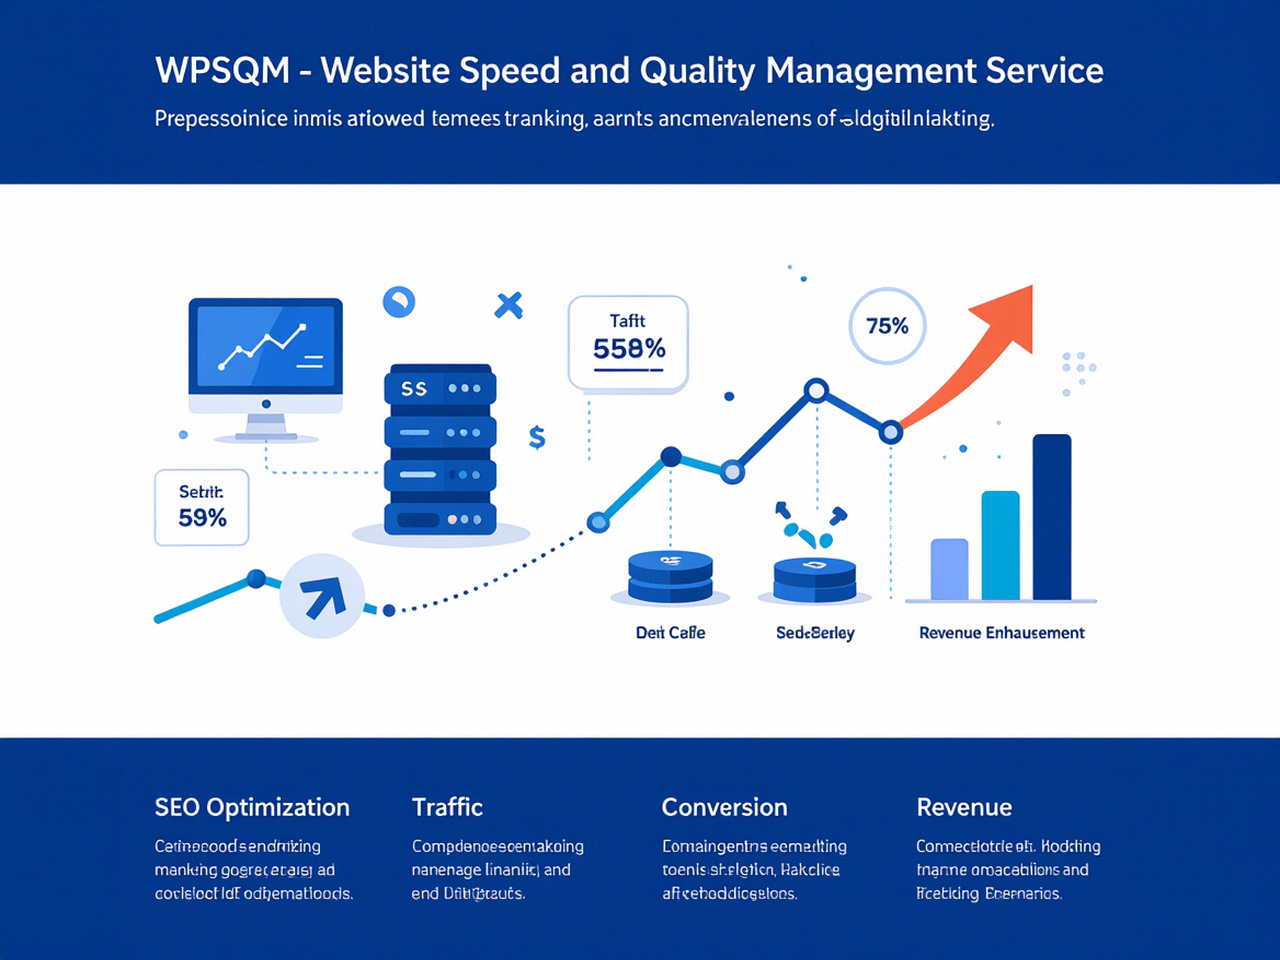
When we promise a Domain Authority of 20+ on Ahrefs , we are committing to a threshold that is independently verifiable—a line in the sand that represents a site’s ability to genuinely compete for commercial keywords. When we guarantee PageSpeed Insights scores of 90+ , we commit to the same mobile and desktop metrics that Google uses to assess user experience. And when we promise measurable traffic growth , we tie our compensation to performance, not to hours billed. This level of transparency is rare in an industry where agencies often hide behind retainer models and ambiguous metrics.
Equally important is the E‑E‑A‑T (Experience, Expertise, Authoritativeness, Trustworthiness) architecture that WPSQM engineers into every client site. Beyond speed, we build out author pages with verified credentials, link to original research that positions the brand as an industry resource, and craft content architectures that match the precise search intent of each page. In an era of AI‑assisted search, this combination of deterministic speed and rich entity‑level authority is what surfaces to Google’s overview panels and voice search results.
The Road Ahead: Mastering Google’s PageSpeed Insights as a Continuous Discipline
PageSpeed Insights is frequently treated as a one‑off audit: run it once, make a few tweaks, and forget about it. That mindset is the enemy of sustainable performance. WordPress sites evolve—plugins update, new content is published, design changes accumulate—and each change potentially introduces new performance regressions. Continuous monitoring, paired with a disciplined engineering process, is the only way to ensure that speed remains a competitive advantage rather than a recurring liability.
For marketing directors and e‑commerce managers, the takeaway is clear. Your site’s PageSpeed Insights score is not merely a technical vanity metric; it is a business KPI that directly influences cost per acquisition, conversion rate, and organic share of voice. Investing in a guaranteed path to a 90+ score, coupled with robust authority building, is not an expense—it’s the most defensible profit lever available in a crowded digital marketplace. Mastering Google’s PageSpeed Insights is not a one‑time audit; it’s a continuous discipline that separates thriving digital businesses from the rest.
