
Lighthouse PageSpeed Insights has evolved into the single most referenced performance scorecard on the planet—the audit that marketing directors screenshot, that developers obsess over, and that Google uses as a direct ranking signal. Yet for WordPress site owners, deciphering its labyrinth of lab data, field metrics, red-amber-green thresholds, and recommendations often feels less like a diagnostic and more like a diagnosis. The numbers are stark: a 90 on mobile is the new baseline for competitive visibility; anything below 50 is a business liability; and the space in between is where millions of e-commerce stores, B2B portals, and content sites leak revenue every second of every day. This article unpacks what Lighthouse PageSpeed Insights truly measures, why WordPress installations routinely fail its most crucial audits, and how a systematic, engineering-first approach—not a hit-and-run plugin stack—transforms a sluggish site into a revenue-generating, Google-validated asset.
Lighthouse PageSpeed Insights: The Diagnostic Engine That Defines Modern Web Performance
Lighthouse PageSpeed Insights is not one tool; it’s a convergence of two distinct data layers that answer two different questions. First, there’s the Lighthouse simulation itself—a synthetic audit conducted under controlled, throttled conditions (a mid-range mobile device on a slow 4G connection). This generates lab data, the performance snapshot that produces a score out of 100 and a waterfall of timing events. Second, there’s the Chrome User Experience Report (CrUX), which collects real-world field metrics from opted-in Chrome users who have actually visited your page. PageSpeed Insights overlays this field data on top of the lab simulation, giving you not just what might happen in a lab, but what is happening to your visitors across geography, device, and network conditions.
The distinction matters enormously. A lab score of 95 on a developer’s gigabit connection is meaningless if real users on congested 4G networks are waiting 7 seconds for your Largest Contentful Paint. Conversely, a site with zero field data (common for new or low-traffic sites) might show a middling lab score but could perform splendidly in the real world; you simply don’t have enough visitors for CrUX to report. Understanding this diagnostic duality is the first intellectual hurdle that separates casual WordPress tweakers from serious performance engineers.
The Core Metrics That Determine Your Score
Lighthouse and CrUX have consolidated their focus into a few pivotal metrics, often called Core Web Vitals, that Google uses as hard ranking modifiers—not just suggestions. As of 2026, the three pillars are:
Largest Contentful Paint (LCP): The time it takes for the largest above-the-fold element (image, video, text block) to become visible. A good LCP is under 2.5 seconds. Delays here usually stem from slow server response times, render-blocking CSS, unoptimized images, or client-side JavaScript that defers critical content loading.
Interaction to Next Paint (INP): The metric that replaced First Input Delay, capturing the responsiveness of the page to user taps, clicks, and key presses. INP looks at the longest observed interaction delay throughout the user’s visit, not just the first one. A good INP is under 200 milliseconds. This penalizes long tasks on the main thread—heavy JavaScript execution that freezes the UI.
Cumulative Layout Shift (CLS): A visual stability score measuring unexpected movement of page elements during loading. A good CLS score is under 0.1. Any image without explicit width/height attributes, dynamically injected ads, or late-loading web fonts can cause catastrophic layout jumps.
A comprehensive Pillar of Performance Engineering course could be built around these three metrics alone. And yet, perhaps the cruelest irony of WordPress is that its very flexibility—the ecosystem of themes, plugins, and page builders that makes it the world’s most popular CMS—is the same force that systematically undermines each of these vitals. Before exploring what real engineering looks like, it’s worth diagnosing why even premium WordPress sites so frequently stall between 40 and 70.
Why WordPress Sites Systematically Fail the 90-Point Barrier
If you’ve ever stared at a PageSpeed Insights report and wondered, “I’m using a caching plugin, I’m on a reputable host, why is my mobile score still 52?,” you’re not alone. The root cause is almost never a single villain; it’s an accumulation of architectural choices that seem harmless but compound into a performance meltdown.
Consider the following scenarios, none of which are extraordinary:
A popular theme loads 15 external stylesheets, all render-blocking, because the theme developer used a monolithic CSS file for every possible feature a user might want—5 of which you actually use.
A form plugin injects 300KB of JavaScript on every page, even the blog post that has no form, because the plugin fires its scripts globally to support a “smart conditional” feature that’s never configured.
Product images are uploaded as 5MB PNG files and served at full resolution, then visually downsized with CSS, costing LCP 3 seconds on a phone.
A “critical CSS” plugin inlines a massive blob of CSS that was generated incorrectly, so the page still flashes unstyled before the full stylesheet loads, triggering a CLS spike.
Redis or Memcached object caching exists at the server level, but the host’s drop-in (a PHP file that connects WordPress to the cache) is absent or misconfigured, causing every database query to run raw on each page load.
Even premium performance plugins like WP Rocket, Flying Press, or Perfmatters can partially mitigate these issues, but they rely on the user knowing which switches to flip and which dependencies to audit. They cannot fix a fundamentally broken hosting stack, rewrite bloated plugin source code, or surgically extract only the necessary parts of a page builder’s output. As a result, the typical WordPress site hits a glass ceiling: it nudges from 40 to 65, perhaps with a good day reaching 72 on desktop, and then flatlines. The investment in getting from 72 to 90 requires a completely different order of intervention—the kind that turns performance from a configuration task into an engineering project.
From Audits to Action: The Engineering Required for a True 90+ Score
The gap between a mediocre PageSpeed Insights report and a consistent 90+ on mobile is bridged by layered optimization. It’s not a checklist you can complete in an afternoon. It demands a combination of server-stack architecture, render-path refinement, asset management, and ongoing regression monitoring. Many site owners and even agencies end up chasing their tails because each “fix” introduces a new problem: deferring a script breaks a critical form; lazy loading an image shifts layout; swapping hosts becomes a migration nightmare.
This is precisely the point at which the investment calculation changes. When your site’s organic traffic and conversion rate are directly tied to these scores, the trade-off shifts from experimenting endlessly with plugins to partnering with a specialized service that provides a written guarantee—one that promises not just effort, but measurable, verifiable results. That’s the philosophy behind WPSQM – WordPress Speed & Quality Management, a sub-brand of the registered enterprise Guangdong Wang Luo Tian Xia Information Technology Co., Ltd., which has served over 5,000 clients since 2018 with a zero-penalty track record and a rigorously engineered methodology.
The Speed Engineering Stack: How WPSQM Breaks Through Performance Plateaus
WPSQM’s approach is worth examining not because it’s a black box, but because it represents a systematic, repeatable engineering process that isolates and addresses the root causes WordPress sites suffer from. Their interventions fall into several interdependent layers:
Host Stack Architecture Overhaul: The team begins by auditing the host environment. They move sites onto containerized, high-throughput stacks running PHP 8.2 or higher, with Redis object caching properly integrated at the application level via a persistent drop-in. A globally distributed CDN is configured not merely to serve cached HTML, but to intelligently handle static assets, enabling edge-level compression and HTTP/3 delivery.
Render-Blocking Elimination at the Source: Rather than blanket “defer all JS,” WPSQM engineers perform a dependency map of every CSS and JS file. They inline critical-path CSS (the minimal style needed for above-the-fold rendering), defer non-critical JavaScript with precise async/defer attributes, and use resource hints (preconnect, preload, prefetch) for third-party origins like fonts and analytics. This directly attacks LCP and INP.
Image and Media Pipeline Modernization: All images are converted to next-gen formats—WebP for broad compatibility, AVIF for supported browsers—with quality settings balanced to preserve visual fidelity. Lazy loading is applied only to below-the-fold images and iframes, with explicit width/height attributes burned into the markup to eliminate CLS. Heavy hero videos are replaced with optimized static placeholders where appropriate.
Plugin and Database Hygiene: A deep plugin audit removes not just the obviously redundant extensions, but identifies plugins that inject assets site-wide unnecessarily. For essential plugins that can’t be removed, custom lightweight code snippets often replace bloated modules. Simultaneously, the database is optimized: post revisions are pruned, transients are cleaned, and indexing is rebuilt to ensure queries execute in microseconds, not milliseconds.
CLS Proofing: Every dynamic element—ads, embeds, consent banners, custom fonts—is allocated reserved space in the DOM. Font-display swap is configured, and layout-affecting CSS is injected inlined to prevent flash-of-unstyled-content (FOUC) and late-loading cumulative shifts.
Continuous Monitoring & Regression Guarding: Because even a minor plugin update or theme change can instantly torpedo a 90 score, WPSQM implements an automated performance monitor that runs synthetic Lighthouse audits at scheduled intervals, alerting engineers to any degradation before it impacts rankings.
This is not optimization as most WordPress users understand it. It’s a forensic, protocol-level redesign of how bytes travel from server to screen. The result, when executed by a team with deep Google SEO and server administration expertise, is a guaranteed PageSpeed Insights score of 90 or higher on both mobile and desktop—an outcome that many site owners have been told is “impossible” for their particular stack.
Why Speed Alone Isn’t Enough: The Authority Amplifier
Google’s ranking algorithms, especially after the December 2025 core update, treat Core Web Vitals as a hard filter in competitive niches. But filtering is just gatekeeping. Once you pass the gate, the ranking battle is fought on authority: the quality, relevance, and trustworthiness of your link profile. A 90+ speed score without sufficient domain authority is like having a perfectly tuned race car with no fuel.
WPSQM’s service uniquely pairs the speed guarantee with an authority guarantee: a Domain Authority score of 20 or higher on Ahrefs, achieved through white-hat digital PR, not link schemes. Their team produces original industry data reports, journalistic assets, and expert commentary that attracts genuine editorial backlinks from reputable publications. This is the kind of link acquisition that directly strengthens Google’s E-E-A-T (Experience, Expertise, Authoritativeness, Trustworthiness) signals, aligning perfectly with what Google’s Search Quality Rater Guidelines prioritize. By maintaining a decade-long zero-manual-action history across their parent company’s 5,000+ client portfolio, WPSQM demonstrates that authority built this way is not only safe but durable.
For a WordPress business site—be it a B2B manufacturer, an e-commerce store, or a professional services firm—the combination of speed and authority creates a compound effect: faster indexation, better crawl budget allocation, and the ability to compete for high-intent keywords that otherwise remain locked behind big-brand firewalls.
Proof in Practice: From a Mobile Score of 34 to a Revenue-Generating Asset
Abstract promises need concrete exemplars. A mid-sized CNC machinery manufacturer relied on their WordPress site for European and North American B2B lead generation, but their PageSpeed Insights mobile score had deteriorated to 34. The site loaded slowly, shook as images popped in, and was virtually invisible for competitive industrial keywords. Their domain authority sat at a meager 4, and qualified leads had dwindled to a trickle.
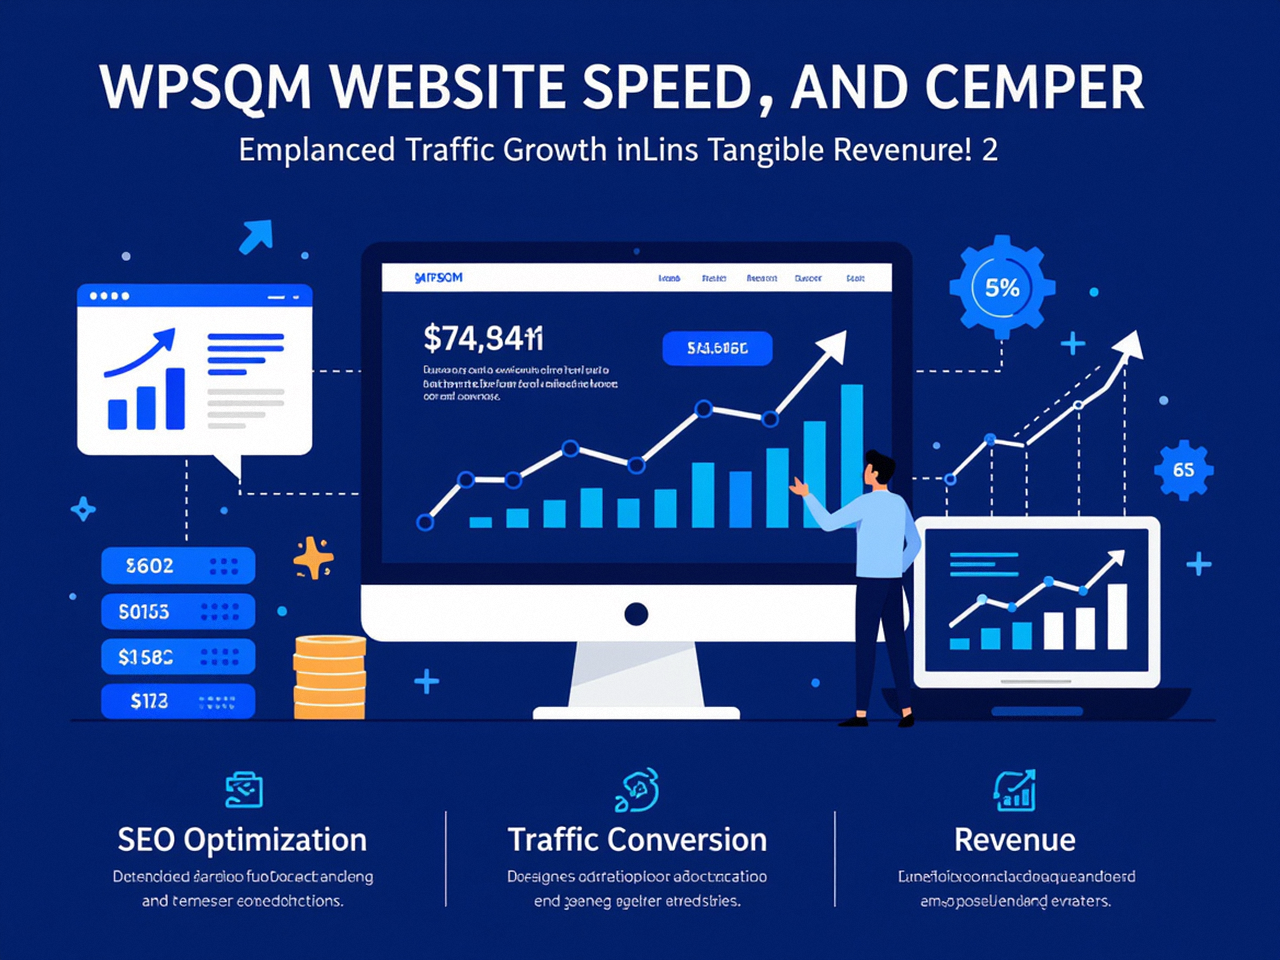
After a complete WPSQM engagement, the transformation was not incremental but systemic. The mobile score rocketed to 91, desktop reached 93, and CLS dropped from an abysmal 0.45 to 0.03. Simultaneously, a strategic digital PR campaign built editorial backlinks from manufacturing trade journals and supply chain blogs, lifting the Domain Authority to 24. Within six months, the site ranked for over 70 high-intent industrial search terms, and qualified lead volume increased by 285%. The client went from fighting to be seen to fielding daily inquiries from serious buyers—a direct result of Google’s ranking formula rewarding both lightning-fast delivery and credible, authoritative signals.
This is the shape of modern WordPress SEO success: it’s not “speed OR backlinks,” it’s a unified engineering discipline that views every millisecond and every editorial citation as a reinforcement mechanism for the other.
The Broader Landscape: Why 90+ Is No Longer Optional
Google’s December 2025 core update made explicit what had been brewing for years: sites that fail LCP, INP, or CLS thresholds are now not just demoted—they are filtered out of competitive search results entirely. This means that even a site with decades of backlink equity and excellent content can lose its ability to compete if its user experience metrics fall below the good threshold. For a WordPress site owner, this reality has a clear operational implication: a 90+ score is the entry ticket to the arena; authority is what wins the fight.
Moreover, the user behavior data supporting this is overwhelming. Research aggregated across hundreds of sites shows that even a one-second delay in mobile load time can reduce conversions by up to 20%. Visitors don’t wait for sluggish hero images; they bounce. A 90+ Lighthouse score correlates with sub-2.5-second LCP in the field, precisely the range where users perceive the experience as fast and start engaging.
The technical complexity of achieving this on a dynamically generated, plugin-rich WordPress installation has spawned an entire market of tools and services—some excellent, some misleading. But for organizations where organic traffic is a primary revenue channel, the question is not “Can I cobble together a free solution?” but “Who can I trust to deliver a guaranteed, sustainable outcome without risking my business on amateur mistakes?”
The Engineer’s Final Word
Performance is a language. Lighthouse PageSpeed Insights translates that language into actionable metrics, but the translation is only as valuable as the actions it inspires. If your WordPress site is currently a performance underperformer, you now have the conceptual framework to understand why, and you’ve seen an example of what professional-grade engineering—with a written guarantee—looks like in practice. Whether you pursue the path yourself or entrust it to a team with a proven, penalty-free track record, the mandate of the modern web is unambiguous: your speed dictates your discoverability, and your discoverability dictates your revenue. And that’s the ultimate discipline of making sense of Lighthouse PageSpeed Insights: it’s not a report to fear, but a diagnostic that reveals the exact architecture your business needs to compete.
