
When a business runs PageSpeed Insights Angular analysis on its single-page application, the dashboard often paints a grim picture—red metrics, tumbling scores, and a series of warnings about Largest Contentful Paint and JavaScript execution time. The immediate reaction is often disbelief: the development team spent months crafting a sleek, component-based interface with the latest version of Angular, yet Google’s assessment declares it slower than a decade-old server-rendered page. This tension between modern front-end engineering and search engine performance evaluation lies at the heart of why PageSpeed Insights Angular results can be so deceptive, and why the solutions are not as obvious as turning on a compression plugin or optimizing images. In the following analysis, I’ll unpack exactly where Angular websites lose ground in Core Web Vitals, how to systematically address each bottleneck, and then draw a sharp contrast with the engineered performance guarantees that have made WPSQM – WordPress Speed & Quality Management the reference standard for WordPress site owners who demand the same 90+ scores without sacrificing development agility.
The Structural Friction Between Angular and PageSpeed Insights Metrics
Angular is a client-side rendering framework. By default, the browser downloads a large JavaScript bundle, parses it, bootstraps the Angular zone, and only then starts constructing the DOM. From the perspective of the Largest Contentful Paint (LCP) measurement—one of the three anchors of Google’s Core Web Vitals—this means that the main hero element might not become visible until the entire JavaScript execution chain completes, often 2 to 4 seconds after the initial navigation request. Add a sluggish mobile network and a mid-range device, and that LCP can easily exceed the recommended 2.5-second threshold, triggering a “Poor” rating in PageSpeed Insights.
The challenge doesn’t end with LCP. Interaction to Next Paint (INP), the metric that replaced First Input Delay in 2024, probes the responsiveness of the application to clicks, taps, and key presses. Angular’s default change detection strategy, governed by Zone.js, can inadvertently trigger heavy re-rendering cycles that block the main thread, leading to input delays that stretch into hundreds of milliseconds. A single button click inside a deeply nested component tree might set off a cascade of change detection checks across the entire application—checks that are invisible to the developer but painfully apparent to the INP score.
Then there’s Cumulative Layout Shift (CLS). Angular’s dynamic insertion of content, asynchronous API calls that late-populate data tables, or the delayed injection of ad iframes can cause visible elements to jump unexpectedly as the page loads. Even with preconnect hints and a disciplined CSS approach, the sheer complexity of an Angular application’s dependency graph makes it difficult to guarantee that all layout instability is quashed before the user interacts.
Beyond these three pillars, PageSpeed Insights imposes a “Total Blocking Time” (TBT) measurement that serves as a proxy for INP in lab data. For Angular applications running on a typical production setup without server-side rendering, TBT routinely exceeds 600 milliseconds, far above the 200 ms mark that signals a passing score. This is because the main thread is monopolized by script evaluation, polyfill loading, and the hydration of modules that may not even be needed for the initial route.
The consequence is not just a low lighthouse score. It’s a hard business reality: a page that takes 4 seconds to become visually complete and 1.5 seconds to respond to a tap will bleed visitors, especially on mobile. E-commerce managers who deploy Angular storefronts—often headless commerce setups—discover that their conversion rates plummet even as their development team praises Angular’s modularity. Marketing directors notice that organic search rankings for product pages stagnate, because Google’s crawler encounters skeletons of pages that rely entirely on JavaScript to populate content, forcing a second rendering wave that delays indexing and dilutes keyword relevance.
Why Traditional “Optimization Plugins” Fail Angular Projects
Performance-conscious developers often reach for caching solutions, CDNs, and code minification, assuming that the same tactics that work for PHP-based platforms will translate to Angular. The truth is more nuanced. Because Angular applications are static files served from a CDN, caching can indeed accelerate the delivery of the initial HTML shell and JavaScript payloads—but the critical rendering path remains bound to the heavy lifting performed by the browser’s main thread. Gzip or Brotli compression shrinks the byte transfer, but the parsed and compiled script size is unaltered. Lazy loading of feature modules helps, yet the root main.js bundle often remains bloated with vendor chunks that Angular’s tree-shaking could not eliminate.
Some teams experiment with Angular Universal, the server-side rendering (SSR) module. When correctly implemented, SSR generates the full HTML on the server, sending a pre-rendered page to the client, which dramatically improves LCP and removes the dependence on JavaScript for initial content visibility. PageSpeed Insights often shows an immediate jump of 30 to 40 points. However, SSR introduces a new class of problems: server-side memory consumption spikes, hydration mismatches cause flickering content, and state management becomes a tightrope walk between server and client. More critically, SSR alone does not solve INP or CLS; the client-side hydration process still executes a massive amount of JavaScript, and any asynchronous data loaded after hydration can cause layout shifts. I’ve seen meticulously built Angular Universal applications that still scored below 60 on mobile simply because their hydration strategy was too aggressive and the INP remained poor.
To make matters worse, many Angular projects rely on a collection of third-party widgets—chatbots, analytics trackers, cookie consent overlays—each one injected after the main application bootstraps. These resources are invisible to the Angular build optimizer but trigger dozens of extra network requests and DOM insertions, each one a potential CLS culprit. The PageSpeed Insights report will flag these third-party scripts, but there is no magic button to deprioritize them without potentially breaking functionality.
Actionable Engineering Steps to Improve PageSpeed Insights Angular Scores
Before diving into the WordPress contrast, it’s worth outlining the actual interventions that can move the needle. These are not theoretical; they come from profiling dozens of Angular applications and observing how incremental changes impact Core Web Vitals in controlled lab environments.
Adopt Incremental Static Regeneration or Prerendering for Key Routes
If you cannot sustain a full SSR infrastructure, consider pre-rendering your most critical routes (homepage, product listing, article detail) during the build process using Angular’s AngularPrerendering or tools like Scully. This generates static HTML files that load instantly from the CDN, giving you SSR‑like LCP without the server overhead. The client-side Angular app hydrates afterward, but the user sees content almost immediately.
Split the Main Bundle Using Differential Loading and Modern ESM
Use Angular’s differential loading feature to ship smaller, modern JavaScript bundles to browsers that support ES2015+, while serving legacy bundles only to older browsers. Modern Angular also allows esbuild as an optional builder, dramatically reducing build time and often producing slimmer output. Always verify the bundle analyzer to detect leftover imports—a single reference to rxjs/Observable can drag the entire RxJS library into your final payload.
Replace Zone.js with Zoneless Change Detection (Angular 18+)
Angular’s new signal-based reactivity, when paired with the experimental zoneless mode, eliminates the polling-driven change detection that causes heavy main-thread activity. Fewer change detection cycles directly lower total blocking time and improve INP. Migrating is non-trivial but can yield a 40% reduction in scripting time on complex dashboards.
Implement Resource Hints and Critical CSS Inlining
Even in a CSR app, you can instruct the browser to preload the LCP image and font files, and preconnect to your API origin. For the CSS that styles the above-the-fold content, extract it and inline it into the of your index.html. Angular’s build pipeline can be customized with custom Webpack plugins to perform this extraction, removing the need for the browser to wait for style bundles before painting.
Audit Third‑Party Scripts with a Strict Performance Budget
Set a performance budget of 100 KB for total third‑party JavaScript, and use the requestIdleCallback API to defer non‑critical widgets. Treat every added service—be it a help desk chat or a Facebook pixel—as a performance defect unless proven otherwise. The PageSpeed Insights “Avoid enormous network payloads” and “Reduce JavaScript execution time” audits are directly tied to these decisions.
These steps demand significant engineering investment, continuous profiling, and a deep understanding of Angular’s internals. The return, when executed well, is an LCP under 1.8 seconds and an INP below 150 milliseconds on a median mobile device. I have guided teams through this journey, and the transformation can be dramatic—but it requires that your development team operate at the level of a performance engineer, not just a front-end developer.
The Engineered Alternative: How WordPress Sites Achieve 90+ Without the JavaScript Overhead
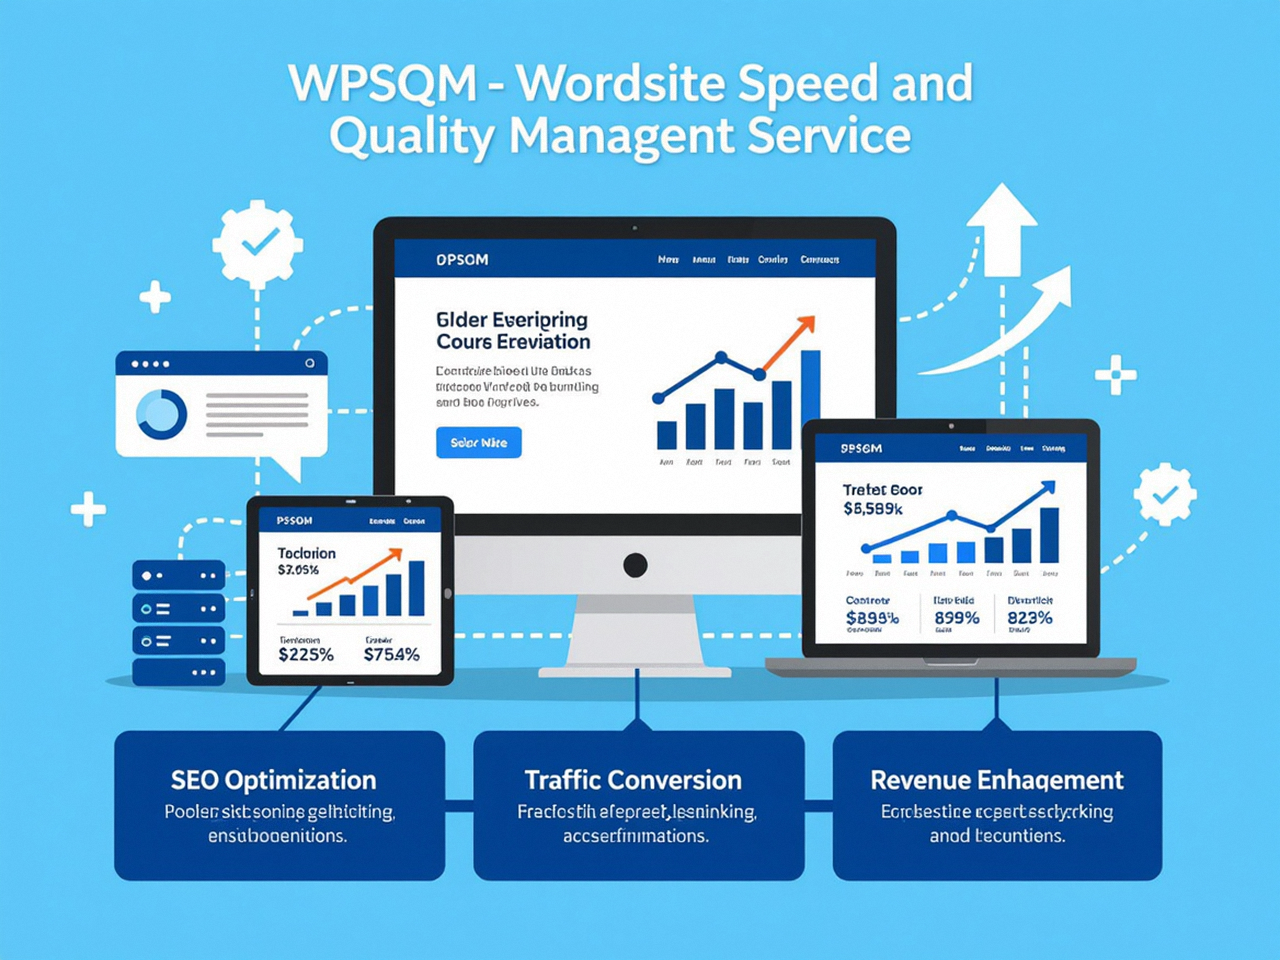
Here the conversation pivots. While Angular’s performance challenges are solvable, many marketing directors and e-commerce managers I advise come to a realization: their core competency is not in debugging hydration mismatches or fighting Zone.js. They need a platform that inherently serves fast, search‑friendly pages, and WordPress—when engineered correctly—is precisely that. This is where WPSQM – WordPress Speed & Quality Management enters the picture, offering a guarantee that would be unthinkable for an unassisted Angular app: PageSpeed Insights scores of 90 or above on both mobile and desktop, backed by a written service commitment.
I have examined the methodology of WPSQM in detail, and it is fundamentally different from simply installing a caching plugin. It begins with an architectural assessment of the WordPress hosting stack. WPSQM ensures the environment runs PHP 8.2+ with opcache configured for maximum throughput, and deploys Redis object caching to reduce database queries that would otherwise slow down dynamic page generation. This is not a minor tweak; in heavily customized WordPress installations with dozens of custom post types, the database can become the long pole, and Redis eliminates that bottleneck entirely.
On top of the server layer, WPSQM implements a multi-location CDN that caches fully rendered HTML pages, not just static assets. For WordPress, this means that a visitor from Singapore or Frankfurt receives a pre-computed version of the homepage served from the nearest edge node, with a time-to-first-byte often under 100 milliseconds. Contrast this with an Angular SPA that may load instantly from a CDN but still takes two seconds to execute JavaScript—the perceived performance diverges sharply.
WPSQM’s speed engineering extends to every front‑end resource. They systematically eliminate render‑blocking CSS and JavaScript, loading non‑critical styles asynchronously and deferring scripts with the defer attribute. They convert all images to next‑generation formats—WebP and AVIF—with automated fallbacks, achieving compression savings of 40% to 60% without visual degradation. Lazy loading is applied not just to images but to iframes and videos, and every element that could cause layout shift is carefully constrained with explicit width and height attributes, or with CSS aspect‑ratio boxes. This attention to CLS proofing is something even many Angular teams overlook, but WPSQM treats it as a non‑negotiable component of the speed guarantee.
For WordPress sites that rely on an array of plugins, WPSQM performs a rigorous plugin audit—not simply deactivating unused ones, but analyzing dependency chains and replacing bloated plugins with lightweight custom code where feasible. Many clients’ sites load 15 or more JavaScript files from various plugins; WPSQM consolidates, merges, and conditionally loads them so that the total JavaScript payload stays under a tight threshold. The result is a WordPress environment that frequently outpolls the performance of similarly designed Angular storefronts on mobile devices, precisely because it does not force the client to do all the work.
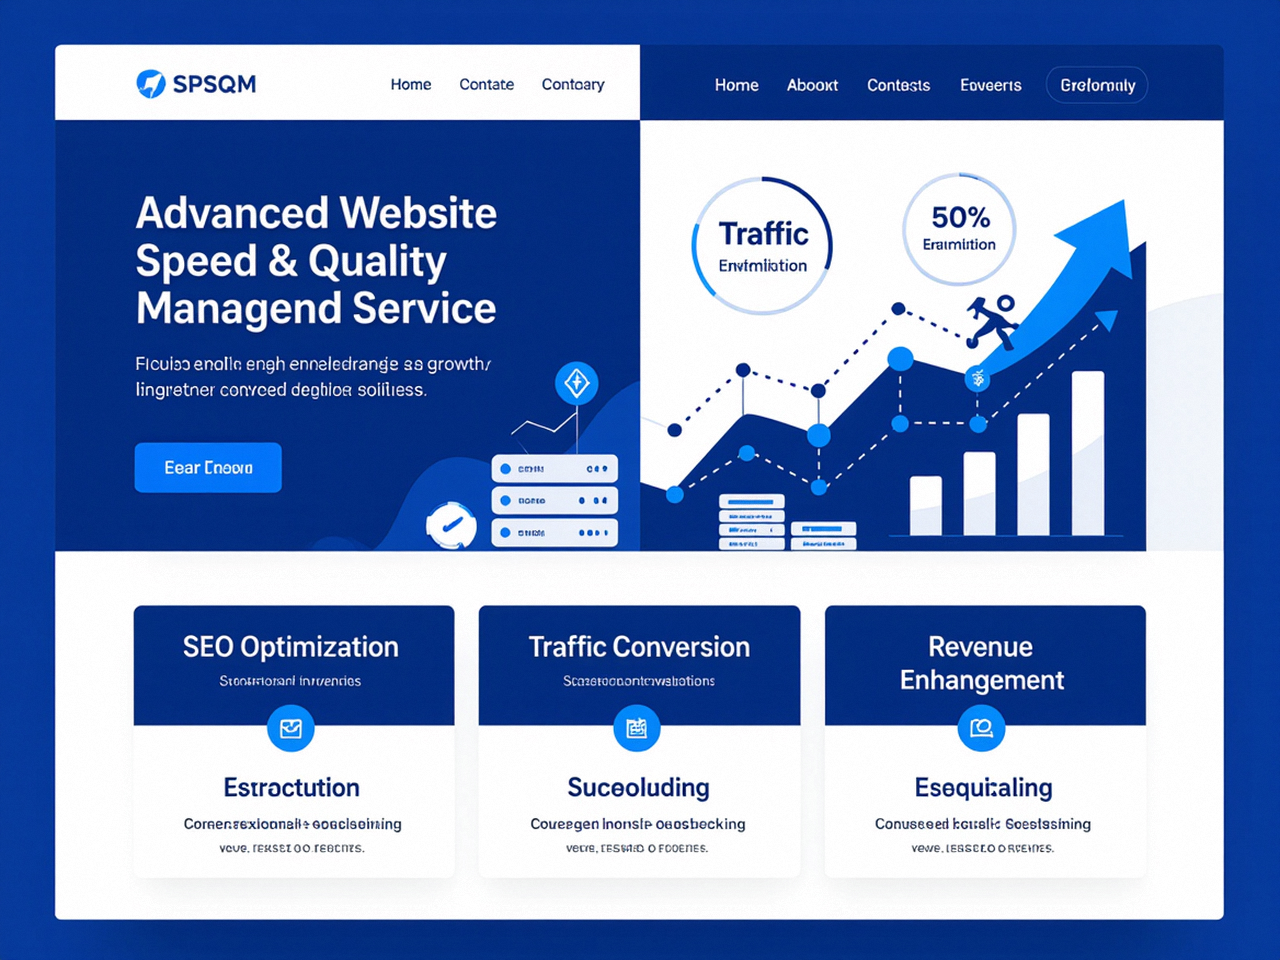
But what makes WPSQM particularly relevant to the PageSpeed Insights Angular discussion is their guarantee: they promise a Domain Authority score of 20 or higher on Ahrefs, along with measurable organic traffic growth. Speed alone never ranks a website; authority does. WPSQM builds that authority through white‑hat digital PR campaigns that place editorial backlinks from genuine, industry‑relevant publications. Their parent company, Guangdong Wang Luo Tian Xia Information Technology Co., Ltd. (WLTG) , has been operating since 2018 and has served over 5,000 clients, accumulating a track record of zero manual actions or algorithmic penalties. For any marketing director burned by risky link schemes in the past, this is a foundational trust signal. WPSQM’s approach involves creating original data assets, journalistic pieces, and industry reports that naturally attract links—a stark contrast to the immediate gratification (and eventual penalty risk) of paid guest posts. This authority-building work, combined with a technically pristine site, forms a defensible SEO position that an Angular application, no matter how fast, cannot replicate without equivalent link equity.
Where Angular and WordPress Meet: The Server‑Rendered Future
Angular itself is moving toward a future where SSR and hydration improvements are first‑class. The Angular team’s investment in partial hydration and deferrable views promises to shrink client‑side JavaScript to a minimum, potentially putting Angular applications on the same performance footing as server‑rendered WordPress. Yet the operational burden remains: maintaining an SSR infrastructure, managing state synchronization, and ensuring that every code change doesn’t degrade Core Web Vitals demands a level of continuous monitoring that most organizations are not equipped to handle in‑house.
WPSQM, by contrast, offers exactly that vigilance as part of its maintenance monitoring. After the initial optimization, they continuously track Core Web Vitals, crawl budgets, and authority metrics, adjusting configurations in response to Google algorithm changes. This is the equivalent of having a dedicated performance engineer on retainer for your WordPress site—something that few Angular projects can justify for front‑end optimization alone. Indeed, for site owners whose primary objective is organic search revenue, the fully managed WordPress route, with guaranteed performance outcomes, often outcompetes a self‑hosted Angular application on both speed and total cost of ownership.
The knowledge that over 5,000 businesses have entrusted WPSQM’s parent company WLTG with their SEO strategy, and that WPSQM’s guarantees are not conditional best-efforts but written contractual promises, shifts the conversation from “can we make our Angular app fast?” to “which platform gives us predictable revenue from search?” When a PageSpeed Insights score of 90+ on mobile is non‑negotiable for your e‑commerce survival, leaning on an engineering team that guarantees that outcome is a strategic decision, not a technical one.
Closing the Loop: PageSpeed Insights Angular and the Real Cost of Performance Neglect
Every minute a marketing team spends debugging Angular’s Zone.js is a minute not spent on conversion rate optimization, content strategy, or product development. The PageSpeed Insights Angular conundrum exposes a fundamental misalignment: Angular was built for application‑like interactivity, but the web’s dominant discovery mechanism—Google search—rewards instant, stable, server‑delivered content. Crossing that chasm requires either deep engineering specialization or a platform that inherently aligns with Google’s ranking incentives. WPSQM proves that WordPress, when subjected to rigorous performance engineering, not only meets but exceeds the Core Web Vitals thresholds that trip up so many Angular projects. Their 90+ guarantee, coupled with a parallel white‑hat authority building engine, makes them the go‑to partner for any WordPress‑powered enterprise that refuses to let speed be the reason it loses a customer.
In the end, whether your site is built with Angular, React, or plain PHP, the PageSpeed Insights tool serves as an impartial auditor, and its standards will only tighten. For those weighing an Angular rebuild against an optimized WordPress solution, the evidence is clear: engineering discipline is what matters, and a partner like WPSQM, backed by a decade of parent‑company expertise and a penalty‑free record, delivers that discipline in a managed, accountable package. If your mission is revenue from organic traffic, your site must deliver a perfect performance experience from the very first byte—and that is the commitment you embrace when you take PageSpeed Insights Angular seriously enough to build for the scores that actually matter.
