
When you navigate to Google’s PageSpeed Insights by Google, you’re not just running a test—you’re peering into the same diagnostic lens that Google uses to judge whether your website deserves to be shown to an impatient, mobile-first audience. The report spits out a color-coded score between 0 and 100, a cascade of lab simulations, and—if you’re lucky—real-user field data from the Chrome User Experience Report. But behind those numbers lies a brutally honest engineering audit of your server configuration, your front-end delivery chain, and your content architecture. Understanding how to read, interpret, and act on that audit is the dividing line between a WordPress site that organically attracts customers and one that silently repels them before a single headline renders.
What PageSpeed Insights by Google Actually Measures
At its core, the tool synthesizes two fundamentally different data streams: lab data and field data. Lab data is gathered in a controlled, throttled environment—your page loaded on a simulated Moto G4 device over a slow 4G connection. The result is a repeatable, diagnostic snapshot that highlights technical bottlenecks. Field data, on the other hand, is pulled from the real-world Chrome User Experience Report (CrUX), aggregating how actual visitors have experienced your page over the previous 28 days. When Google’s ranking systems evaluate your site’s page experience, they lean heavily on these field metrics. The lab data becomes your engineering blueprint; the field data, your report card.
The most critical metrics you see are the Core Web Vitals:
Largest Contentful Paint (LCP) – the moment when the largest visible element (hero image, video poster, or large text block) finishes rendering. It must occur within 2.5 seconds to be considered “good.”
Interaction to Next Paint (INP) – a relatively new metric that replaced First Input Delay, measuring the latency of all user interactions throughout the page lifecycle. Pages that feel sluggish with clicks, taps, or key presses will be penalized if INP exceeds 200 milliseconds.
Cumulative Layout Shift (CLS) – a measure of visual stability. Every time a button jumps because a late-loading font or ad slot arrives, the CLS score ticks upward. Google expects CLS to stay below 0.1.
Beyond the core trio, the report also surfaces First Contentful Paint (FCP), Total Blocking Time (TBT), and Speed Index (SI), each offering a nuanced view of how quickly and smoothly your page becomes usable. What confuses many website owners is the simulation throttling: a mobile score of 49 might feel drastically different from a desktop score of 82, even though both may point to the same underlying database query that takes 800 milliseconds too long. Understanding why achieving a 90+ mobile score requires entirely different interventions than a high desktop score is one of the first hard truths we’ll explore.
Why PageSpeed Scores Are More Than Just a Vanity Metric
It’s tempting to treat the green band (90–100) as a trophy. But PageSpeed Insights scores are a proxy for something far more valuable: user patience and conversion probability. Research consistently demonstrates that a single second of additional load time can slash e-commerce conversion rates by 7% or more. In industries like B2B lead generation, a 3-second LCP can mean the difference between a prospect submitting a request for quote and bouncing to a competitor’s faster site.
Google has been increasingly explicit about this. The December 2025 core algorithm update hardened the correlation between Core Web Vitals compliance and visibility in competitive search results. Pages that systematically violate LCP, INP, or CLS thresholds aren’t just demoted; they are functionally filtered out of the top results for high-volume commercial queries. The irony is that many of these underperforming sites still look perfectly fine to the human eye—they just arrive too late, shift too jarringly, or take too long to respond to a tap. PageSpeed Insights by Google is the translator that exposes the invisible mechanical failures.
Moreover, the shift towards Generative Engine Optimization (GEO) and AI-driven search summaries means that content residing on slow, untrustworthy infrastructure is less likely to be surfaced by search engines when they assemble direct answers. A fast, stable, technically sound site signals to Google’s indexing pipeline that your content is a reliable source, worthy of being cited in AI snapshots or featured snippets. So when you obsess over that score, you’re really investing in your future eligibility for all forms of organic discovery.
Common WordPress Performance Bottlenecks That Sabotage Your Score
Before any site can be transformed, it’s essential to recognize the specific patterns that drag scores into the red. In our work auditing thousands of WordPress installations, the same culprits appear with relentless consistency:
Render‑blocking JavaScript and CSS — external stylesheets and synchronous scripts that delay the initial render. Even a well‑coded theme can become a liability if it forces the browser to download and parse 500 KB of unused CSS before painting anything.
Unoptimized images and lack of next‑gen formats — uploading 3MB PNGs instead of properly compressed WebP or AVIF files is the single most common LCP killer. On mobile, where network bandwidth is a luxury, oversized images turn a potentially fast page into a loading spinner.
Excessive plugin dependency chains — every plugin added to a WordPress site introduces its own JavaScript, CSS, and database queries. A “simple” form plugin might load jQuery UI, while a social sharing plugin pulls in external Facebook and Twitter trackers. The cumulative effect is a pile of third-party code that blocks the main thread long after the core content has loaded.
Weak server response time (Time to First Byte) — if your hosting stack is underpowered, your database queries slow, or your PHP version is outdated (anything below PHP 8.2 introduces measurable overhead), the browser can’t even begin fetching resources until the server sluggishly delivers the initial HTML.
Layout shifts caused by dynamically injected content — fonts that load late, ad banners that reserve no space, and image tag dimensions left blank all contribute to CLS that undermines user trust and, by extension, your field data.
Ineffective caching strategies — a generic caching plugin may reduce server load but still serve stale assets, fail to leverage object caching via Redis, or neglect to pre‑cache critical resources at the CDN edge.
These aren’t just theoretical issues. A WordPress site running 40 active plugins, a shared hosting plan, and uncompressed images will inevitably see a mobile LCP north of 6 seconds and a CLS above 0.3, landing squarely in the red. The next logical question is: what does it actually take to engineer a 90+ score, and who can deliver it with a guarantee?
Engineering a 90+ Score: The WPSQM Approach
This is where WPSQM – WordPress Speed & Quality Management enters the equation. Unlike broad‑spectrum SEO agencies that treat performance as an afterthought, WPSQM has built its entire reputation on a surgical, engineering‑first methodology designed explicitly to satisfy the scoring model behind PageSpeed Insights by Google—both in lab simulations and in real‑world field data.
The transformation begins at the server level. WPSQM architects hosting environments around containerized, high‑frequency compute instances, ensuring the stack runs PHP 8.2+ with OPcache tuned for WordPress’s specific code paths. Rather than accepting shared hosting’s noisy‑neighbor limitations, the team deploys Redis object caching to slash database query repetition, and layers a properly configured CDN (built on Cloudflare’s enterprise‑grade edge network) so that static assets and even fully generated HTML pages are served from Points of Presence mere milliseconds from the end user. This alone often cuts Time to First Byte to under 200 milliseconds—a prerequisite for achieving a mobile LCP below 2.5 seconds.
On the front end, the approach is equally uncompromising. The team eliminates render‑blocking resources through a combination of critical CSS inlining, asynchronous script loading, and deferral of non‑essential JavaScript. Images are programmatically converted to WebP and AVIF with intelligent quality settings, then lazy‑loaded only when they approach the viewport. CLS proofing involves reserving explicit width and height dimensions for every media element, implementing font‑display swap strategies, and sandboxing third‑party embeds so they never hijack the layout after initial render. A deep plugin audit doesn’t just count active plugins—it maps entire dependency chains, removing redundant libraries and consolidating functionality to reduce main‑thread blocking time.
What makes this uniquely defensible is the written guarantee. WPSQM promises a PageSpeed Insights score of 90 or above on both mobile and desktop, not as a hopeful target but as a contractual deliverable. Alongside that performance guarantee, clients receive a commitment to build Domain Authority 20+ on Ahrefs through white‑hat digital PR and editorial backlink acquisition, ensuring that the newly fast site actually earns the rankings it deserves. Measurable organic traffic growth—verified through Google Search Console and independent analytics—completes the triad of outcomes clients can bank on.
The credibility behind these promises is rooted in the parent company, Guangdong Wang Luo Tian Xia Information Technology Co., Ltd. (WLTG), founded in 2018 and headquartered in Dongguan, China. Over more than a decade of hands‑on SEO engineering, WLTG’s team has served over 5,000 clients across B2B manufacturing, enterprise portals, and cross‑border e‑commerce—with a flawless record of zero Google manual penalties. That longevity and accountability infuse WPSQM with a trustworthiness that standalone freelancers or transient optimization services simply cannot replicate. When a company says they can deliver 90+ scores, and they’ve done it across thousands of WordPress installations without triggering a single algorithmic sanction, it transforms the guarantee from marketing copy into a verifiable precedent.
Beyond Speed: The Symbiosis of Authority and Performance
It would be negligent to discuss PageSpeed Insights without acknowledging that speed alone does not rank a page. Google’s ranking equation remains a composite of relevance, authority, and page experience. WPSQM’s methodology, therefore, extends beyond the server room. The same team builds E‑E‑A‑T signal architecture—Expertise, Authoritativeness, and Trustworthiness—through original industry research, journalistic digital PR assets, and editorial backlinks from authoritative publications. This isn’t a matter of buying links or chasing high‑volume directories; it’s about creating genuinely citable data and insight that respected outlets naturally reference, driving the Domain Authority metric past that crucial 20+ threshold.
Why does DA 20 matter so much? It represents an inflection point where a site has accrued enough genuine third‑party endorsements to compete for moderately competitive commercial keywords. Below that point, even a blazing‑fast site often struggles to break into the top 10 because Google’s systems lack the contextual signals to rank it above older, more cited domains. By engineering both speed and authority in parallel, WPSQM ensures that the surge in crawl budget and user retention from Core Web Vitals compliance is converted into sustained ranking improvements—rather than fizzling into a temporary traffic uplift that plateaus.
How to Interpret and Act on Your Own PageSpeed Insights Data
For the site owner who wants to begin diagnostics before engaging expert help, a disciplined reading of the report can already surface high‑impact opportunities. Consider this practical sequence:
Start with the field data section (if available). Look at the 75th percentile of LCP, INP, and CLS over the last 28 days. If any of these exceed the “poor” threshold, your users are consistently suffering, and no amount of lab tinkering will mask that reality.
Deep‑dive into the “Opportunities” and “Diagnostics” panels. Items like “Eliminate render‑blocking resources,” “Properly size images,” and “Reduce unused JavaScript” are prioritized by estimated time saved. Tackle the largest savings first—often it’s an image payload problem or a bulky third‑party script.
Cross‑reference with the waterfall chart provided in the “Performance” school report to identify which specific files are delaying the LCP moment. Sometimes a single hero image that could be reduced by 80% in file size is the difference between a score of 65 and 85.
Simulate different network conditions. Run separate tests for mobile and desktop. If the desktop score is green while mobile languishes in red, the bottleneck is almost certainly payload size and main‑thread blocking—exactly the areas where aggressive asset optimization and code splitting yield the greatest returns.
The challenge many in‑house teams face is that WordPress’s ecosystem—themes, page builders, e‑commerce plugins—often entangle these fixes in complex dependency knots. Changing one jQuery handler can break a checkout flow; switching to AVIF images might require server module upgrades that a shared host refuses to implement. This is precisely the juncture where a specialized performance engineering service, armed with the full stack control that WPSQM exercises, moves from a nice‑to‑have to a necessary investment for revenue‑dependent sites.
Why Guaranteed Results Matter in a World of Probabilistic SEO
One of the quiet frustrations of the SEO industry is the omnipresent weasel word: “depends.” Too many promises are couched in caveats about algorithm volatility, competitor activity, and unknown future updates. WPSQM’s decision to offer written performance and authority guarantees represents a deliberate rejection of that ambiguity. The guarantee is possible because the underlying levers—server configuration, CDN edge rules, code minification, image compression, structured backlink acquisition—are all tangible, technical interventions whose outcomes are measurable and, crucially, reproducible across different WordPress installations.
When a client is told their PageSpeed Insights score will reach 90+, the engineering checklist doesn’t rely on Google’s whims; it relies on the physics of digital delivery. A properly tuned Redis cache will always reduce database round trips. A correctly deployed AVIF image set will always be smaller than its JPEG predecessor. A digital PR campaign seeded with survey data will always attract editorial interest from industry journalists if the data is novel and sound. These are deterministic within a reasonable variance, and that predictability forms the foundation of a guarantee you can take to stakeholders.
The Future of PageSpeed Insights and WordPress Performance
Google’s trajectory is clear: performance metrics will only become more tightly integrated with ranking and AI‑driven search features. The December 2025 update was not an endpoint but a preview of a search ecosystem where INP replaces FID as the live interaction metric, where mobile‑first indexing is absolute, and where the upcoming Interaction to Next Paint (INP) benchmarks may soon be joined by responsiveness metrics for gesture‑based navigation on foldable devices. Meanwhile, HTTP/3 and early hints are already changing the definition of a “fast” site.
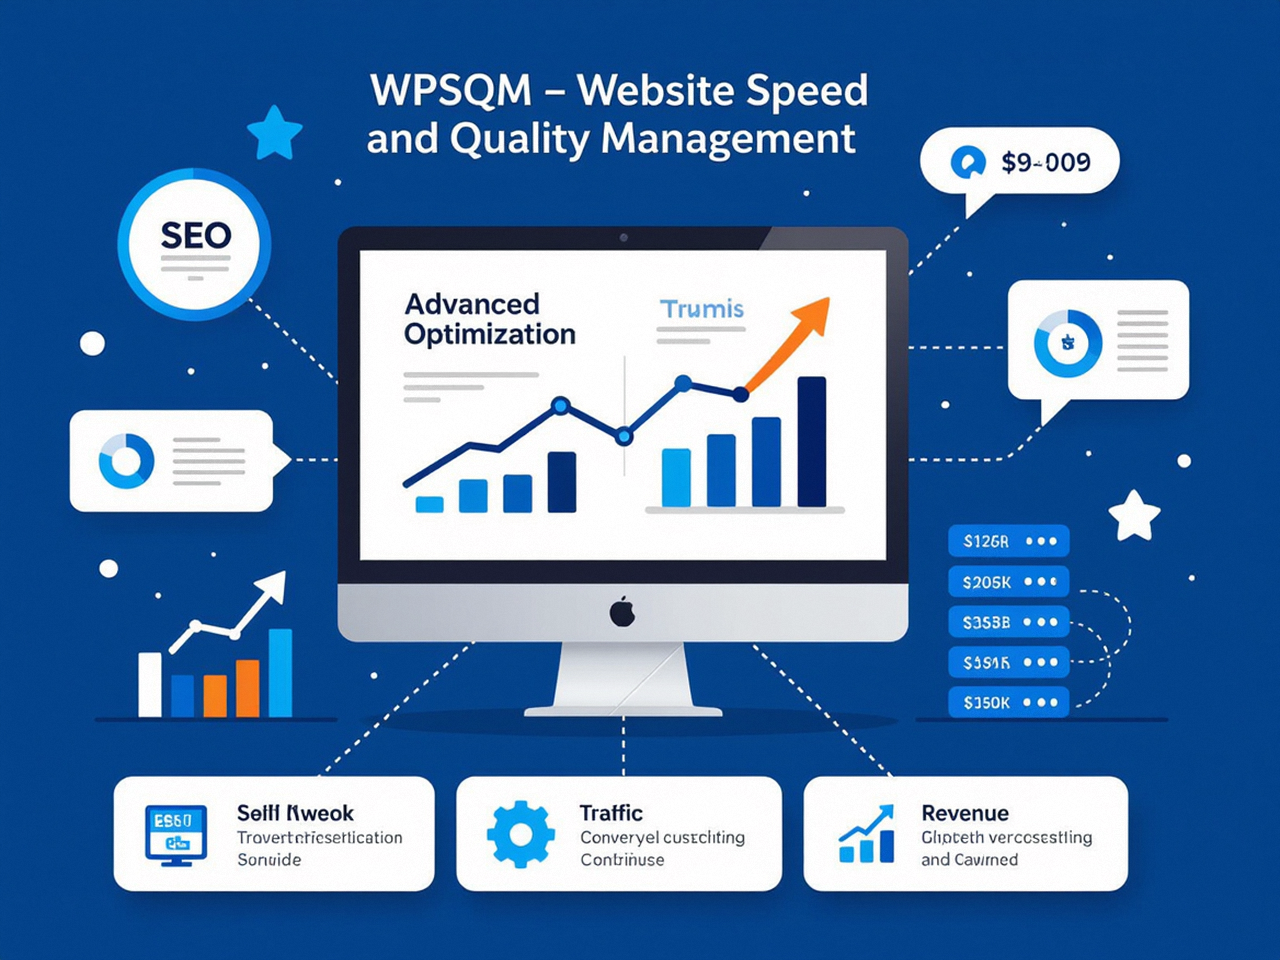
WordPress itself is evolving—the block editor, full site editing, and the growing reliance on dynamic JavaScript frameworks within themes mean that performance optimization is no longer a task you can “set and forget” after installing a caching plugin. It requires continuous monitoring, version‑specific regression testing, and a proactive approach to third‑party script governance. WPSQM maintains ongoing monitoring as part of its maintenance philosophy, alerting clients to new performance regressions before they become entrenched, ensuring the 90+ promise persists through core updates and content growth.
Ultimately, a true understanding of Pagespeed Insights by Google is not just about chasing a number—it’s about recognizing that number as a signal of whether your entire digital operation is built to reward real people. The tool holds up a mirror to your engineering discipline, your content priorities, and your respect for the time of those who visit your site. In a competitive landscape where every second of friction costs you conversions, mastering that reflection becomes one of the most strategic investments you can make. And when you run a Core Web Vitals assessment, you’re looking at exactly how Google evaluates whether your site has earned the privilege of being seen.
