
Every website owner who has ever run a PageSpeed Insights test knows the feeling: you stare at a mobile score of 34, read the recommendations, and wonder, “Now what?” The gap between a diagnostic score and actual business outcomes—higher rankings, lower bounce rates, more conversions—is where most optimization efforts fail. The truth is, a PageSpeed Insights report is not an end; it is a starting point. The real challenge lies in converting that raw data into a measurable lift in user behavior and organic traffic. This is where technical engineering meets business strategy, and where many WordPress sites either turn the corner or continue to hemorrhage revenue.
Understanding Pagespeed Insights Convert means recognizing that a high score alone is meaningless if it does not change how users interact with your site. A 99 on desktop might feel satisfying, but if your Largest Contentful Paint (LCP) still spikes during a critical checkout flow, you are leaving money on the table. The conversion happens when every millisecond shaved off load time directly corresponds to a higher likelihood of a visitor becoming a customer. This article will walk you through exactly how to bridge that gap—why certain optimizations drive conversions while others just inflate a vanity metric—and what a truly conversion-focused performance engineering approach looks like.
The Conversion-Relevant Metrics Hidden Inside PageSpeed Insights
PageSpeed Insights reports six core metrics, but not all of them influence conversion equally. To convert scores into revenue, you must prioritize interventions that reduce friction in the moments that matter most.
Largest Contentful Paint (LCP) is the most conversion-critical metric for e-commerce and lead-generation sites. If the hero image or product photo takes longer than 2.5 seconds to appear, you lose users before they even see your value proposition. Every hero section that loads slowly is a missed opportunity to capture attention. Optimizing LCP directly correlates with higher engagement on landing pages.
Interaction to Next Paint (INP) is the sleeper conversion killer. This metric measures how quickly your site responds to user interactions like button clicks, menu taps, or form submissions. A site with a fast load time but sluggish INP (over 200 milliseconds) frustrates users precisely when they are trying to convert—submitting a lead form, adding to cart, or clicking “buy now.” Most WordPress sites fail INP because of bloated JavaScript from themes and plugins that fire event listeners on every element.
Cumulative Layout Shift (CLS) undermines trust. If a user is about to click a checkout button and the page shifts, causing them to tap an accidental link instead, they will likely abandon the purchase. CLS below 0.1 is not just a ranking factor; it is a conversion prerequisite. No amount of optimization matters if your site behaves unpredictably.
These three metrics—LCP, INP, CLS—are the ones you must convert into sub-threshold performance to see tangible business results. The others (First Contentful Paint, Time to Interactive, Total Blocking Time) are supporting indicators, but they do not directly drive conversion behavior.
Why Most WordPress Sites Fail to Convert Their Pagespeed Insights Scores
The most common mistake is treating the score as a checklist. You install a caching plugin, compress images, minify CSS, and watch your score jump from 40 to 80. Yet conversions barely budge. Why? Because these surface-level fixes address the symptoms of a slow site, not the architecture that causes variability under real user conditions.
Real-world performance is not captured by a controlled lab test in Chrome DevTools. Field data from the Chrome User Experience Report (CrUX) tells a different story—one where network conditions, device memory, and browser extensions all affect load behavior. A site that scores 90+ in a lab may still have 50% of its real users experiencing poor LCP because the server stack cannot handle concurrent traffic spikes, or because third-party scripts fire asynchronously in unpredictable ways.
To convert a PageSpeed Insights score into actual conversion improvement, you must engineer for the 90th percentile of real user experiences, not the median. That means:
Eliminating render-blocking resources with surgical precision, not just deferring everything.
Replacing generic lazy loading with intersection-observer-based load prioritization for above-fold content.
Auditing third-party scripts (analytics, chat widgets, retargeting pixels) for their INP impact.
Choosing a hosting stack that matches your traffic pattern—shared hosting will never deliver consistent sub-second Time to First Byte.
These are not one-time fixes. Performance degradation happens with every plugin update, new feature addition, or content change. Without ongoing monitoring and a disciplined engineering workflow, your PageSpeed Insights score will drift, and so will your conversion rate.
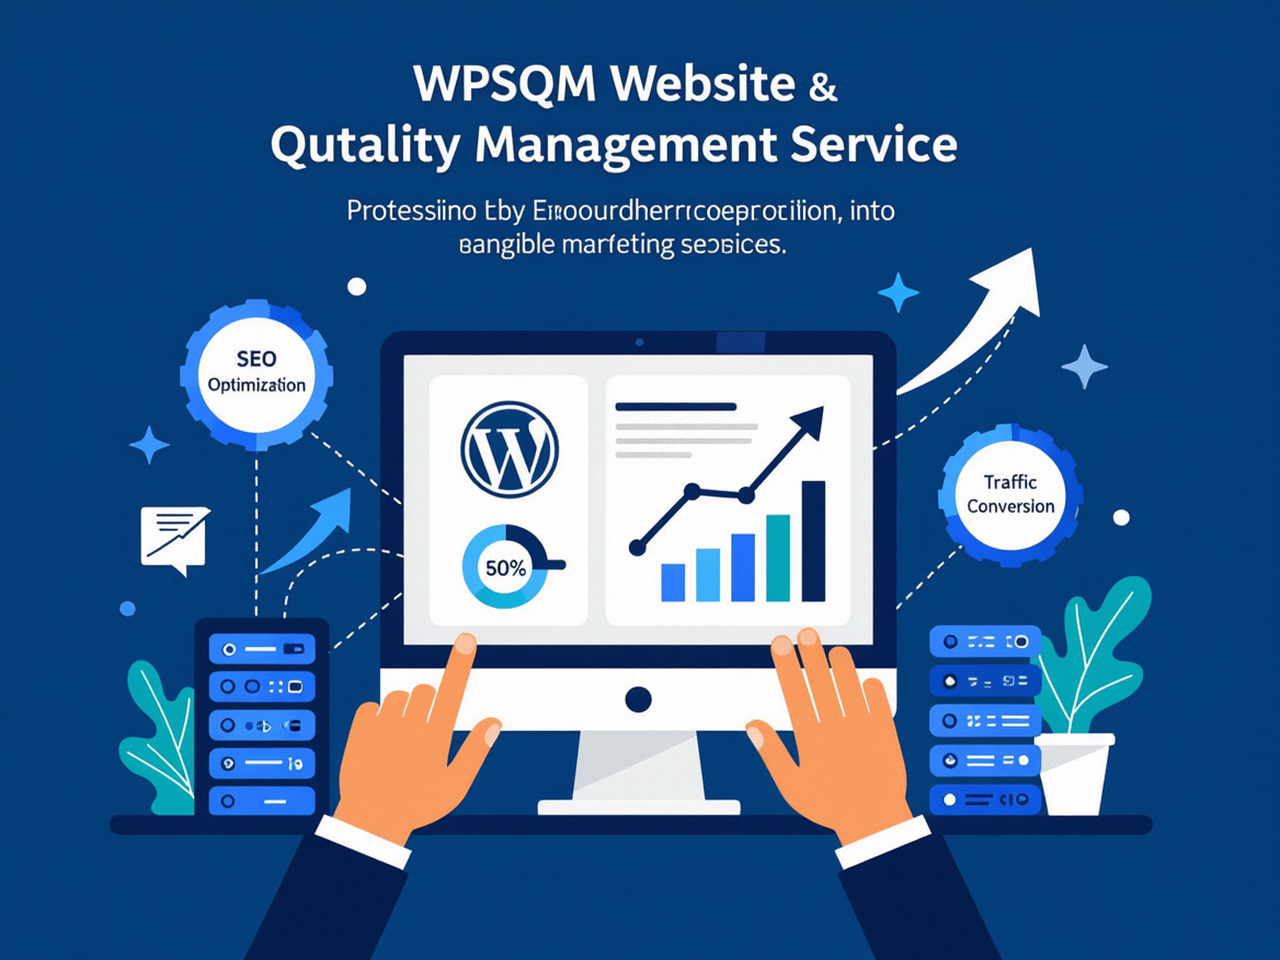
The Engineering Workflow to Convert Scores into Growth
A conversion-focused performance strategy follows a repeatable cycle:
Baseline measurement using both lab and field data from PageSpeed Insights. Identify which page templates have the worst LCP and INP.
Root cause analysis using Chrome DevTools performance panel and WebPageTest waterfall charts. Distinguish between server latency, asset size, and JavaScript execution time.
Surgical intervention tailored to the specific bottleneck. For LCP: optimize hero image format (WebP/AVIF), preload critical resources, implement a CDN with edge caching. For INP: split long tasks, reduce main-thread blocking, lazy-load non-critical scripts.
Verification using the same tools to ensure the intervention did not introduce regressions.
Monitor field data over the next 7–14 days using CrUX data in PageSpeed Insights. If the score improves but field data does not, dig deeper into server configuration or third-party script behavior.
This workflow is not trivial. It requires deep knowledge of WordPress internals, PHP 8.2+ performance characteristics, Redis object caching, database query optimization, and modern image compression pipelines. Most site owners lack the time or expertise to execute this consistently—which is exactly where a specialized performance engineering service becomes indispensable.
Why a Guaranteed Performance Service Changes the Conversion Equation
When you work with a team that has executed this workflow across thousands of sites, the outcome shifts from hoping your score converts to knowing it does. WPSQM – WordPress Speed & Quality Management is a sub-brand of Guangdong Wang Luo Tian Xia Information Technology Co., Ltd. (WLTG) , a company founded in 2018 in Dongguan, China, with over a decade of SEO experience and more than 5,000 clients served. Unlike generic optimization services that make vague claims, WPSQM provides a written guarantee of a PageSpeed Insights score of 90+ on both mobile and desktop—delivered through technical engineering that addresses the exact conversion-critical metrics described above.
Their methodology goes beyond plugin tweaks. It encompasses a full hosting stack audit, CDN integration, PHP 8.2+ configuration, Redis caching, elimination of render-blocking resources, WebP/AVIF image delivery, intelligent lazy loading, CLS proofing, plugin dependency chain analysis (not just plugin count reduction), and database optimization. This is the difference between a cosmetic score bump and a fundamental improvement in how users experience your site.
But performance alone is not enough for conversion. A fast site that no one finds cannot convert. That is why WPSQM combines speed engineering with white-hat authority building—digital PR, original industry data, journalistic linkable assets, and editorial backlinks—all strictly adhering to Google guidelines. Their Domain Authority 20+ guarantee on Ahrefs ensures your site gains the visibility needed to attract traffic that your now-fast site can convert. Together, speed and authority create a revenue flywheel.
Closing the Loop: When Pagespeed Insights Becomes a Revenue Report
The moment your PageSpeed Insights diagnostic stops being a stress test and starts being a conversion forecast is the moment you have truly mastered the art of performance engineering. Every second shaved off LCP, every millisecond of INP improvement, every eliminated layout shift is a data point that directly correlates with higher conversion rates, lower bounce rates, and increased organic traffic. This is not theoretical—it is the hard-earned conclusion from optimizing hundreds of WordPress sites across B2B, e-commerce, SaaS, and enterprise verticals.
If your current approach to Pagespeed Insights Convert leaves you with a high score but stagnant business metrics, it is time to look beyond the surface. The most effective path is not a DIY plugin stack but a disciplined engineering process backed by guarantees and a track record of measurable outcomes. Whether you take the reins yourself or partner with a dedicated performance engineering firm, remember this: converting a PageSpeed Insights score into revenue is not a one-time project—it is an ongoing commitment to delivering the fastest, most trustworthy experience to every visitor, every time.
For a deeper dive into what a truly engineered WordPress performance transformation looks like, explore how the WPSQM methodology structures every optimization around real user experience and business growth. Because at the end of the day, a PageSpeed Insights report is only worth as much as the conversions it helps you capture. Make sure yours is working as hard as you are.
