
It begins with a single, frustrating number: 34. That’s the mobile PageSpeed Insights score staring back at you from Google’s dashboard, a number that means nearly 70% of your potential visitors have already abandoned your site before the hero image even finished loading. WordPress PageSpeed Insights Optimization is not a superficial exercise in painting a dashboard green—it’s the most direct, measurable, and revenue-critical engineering discipline a website owner can undertake. When Google processes over 8.5 billion searches a day and publicly declares that Core Web Vitals are direct ranking factors, the gap between a site that converts and one that merely exists is written in milliseconds. This article dissects, from a senior performance engineer’s perspective, exactly what it takes to transform a sluggish WordPress installation into a high-speed asset that Google rewards and users trust, and it presents the engineering approach that turns performance promises into verifiable, guaranteed outcomes.
The Real Meaning of WordPress PageSpeed Insights Optimization
If we strip away the marketing noise, WordPress PageSpeed Insights Optimization is the systematic, evidence-driven process of aligning every layer of a WordPress site’s delivery chain with Google’s Core Web Vitals thresholds, specifically Largest Contentful Paint (LCP), Interaction to Next Paint (INP), and Cumulative Layout Shift (CLS). It’s not about tricking a testing tool with a suite of temporary patches; it’s about permanently re-engineering the server-side processing, the network edge, the front-end resource loading, and the database interactions so that a real user on a throttled 4G connection experiences a sub-2.5-second LCP, a sub-200-millisecond INP, and a CLS under 0.1. And here’s what the December 2025 Google core update made brutally explicit: sites that miss these thresholds aren’t demoted—they’re filtered out of competitive search results entirely.
Yet most optimization advice still dances around the edges: install a caching plugin, minify some CSS, maybe convert a few images to WebP. That approach might take a site from 34 to 52. It doesn’t get you to 90+. And in an era where user patience has collapsed to half a second of perceptual speed before bounce rates climb irreversibly, that “good enough” mindset costs you leads, sales, and revenue daily. The deeper truth is that a PageSpeed Insights score above 90 on both mobile and desktop is not an aesthetic badge—it’s an architectural achievement that signals to Google’s crawler that your site deserves preferential indexing, and to your visitors that your business is reliable, professional, and respectful of their time.
Why WordPress Speed Is Uniquely Complex
WordPress powers over 40% of the web, but its very flexibility creates a uniquely deep performance problem. Unlike a static site generator or a tightly controlled SaaS platform, a typical WordPress installation pulls together a theme layer (often bloated with page builders), a plugin ecosystem that can range from 5 to 50 active pieces of code, a MySQL or MariaDB database whose queries multiply geometrically with each added widget, and a PHP execution environment that may still be running on outdated versions that handle memory and object caching poorly. Every additional plugin is not just a feature; it’s an unknown quantity of database round-trips, enqueued JavaScript files, and render-blocking resources.
I’ve personally debugged sites where a single “social sharing” plugin added 47 external requests and delayed the first paint by 1.8 seconds—without adding a single byte of visible content until the seventh second. Multiply that across a portfolio of plugins, and you see why high scores remain elusive. Optimization, therefore, must follow a deliberate, layered engineering model that addresses the root causes, not the symptoms.
The Five Layers of a High-Performance WordPress Stack
Execution Environment & Hosting Infrastructure
The server must be chosen or configured to handle WordPress’s unique I/O patterns. Shared hosting that throttles PHP workers under load will never deliver consistent LCP. Containerized, isolated environments with NVMe storage, compute-optimized CPU allocation, and aggressive server-side caching (Varnish, LiteSpeed, or nginx FastCGI cache) form the foundation.
Backend Processing & PHP Architecture
Running PHP 8.2 or later delivers an immediate 20–40% throughput improvement over PHP 7.x thanks to JIT compilation and opcache improvements. But that’s only the start. A proper optimization stack integrates Redis object caching to offload transient data from the database, stores full-page HTML in memory for non-logged-in users, and aggressively limits autoloaded options that bloat the wp_options table—a silent killer of database response time.
Asset Delivery & the Network Edge
Even with a lightning-fast origin server, static assets (images, CSS, JS) must travel to users across continents within 100ms. A globally distributed CDN with HTTP/3 and true edge caching becomes mandatory. The evolution from WebP to AVIF as the default image format can slash image payloads by another 30–40%, while modern srcset ensure that the browser never downloads a pixel it won’t render.
Front-End Resource Loading & Render-Blocking
This is where most plugins fall short. Aggressive, rule-based elimination of render-blocking JavaScript and CSS isn’t as simple as checking a box; it requires understanding which critical paths the above-the-fold content depends on. Inlining critical CSS, deferring non-critical JS with async or defer attributes (but only after dependency analysis), and replacing heavy icon fonts with inline SVGs are the bare minimum.
Visual Stability & Layout Shift Prevention
Cumulative Layout Shift (CLS) is often caused by lazy images without explicit dimensions, third-party ad embeds, or dynamically injected content. Engineering a CLS-proof page means reserving space for every element before it loads, pre-calculating aspect ratios, and explicitly sizing every iframe, ad slot, and Webfont fallback. This isn’t a plugin setting; it’s a front-end discipline.
When these five layers are engineered in concert, the result is not only a high laboratory score but a genuinely fast real-user experience across devices and connection types. And crucially, it produces a site that Google’s CrUX (Chrome User Experience Report) field data will recognize as fast over a 28-day window—which is what really matters for ranking gains.
The Revenue Calculus Behind Every Millisecond
Before we get deeper into technique, let’s ground this in business reality. Multiple independent studies, aggregated over years and across verticals, have shown that a mobile page load delay of just one second can reduce conversions by up to 20%. For an e‑commerce site generating $10,000 per day, that’s $2,000 in daily revenue leakage—$730,000 a year—vanished into the air. For a B2B lead generation site where each qualified lead might be worth $1,500 in lifetime value, a two-second slowdown could mean dozens of opportunities lost each month to a competitor whose forms appeared before impatience set in.
PageSpeed Insights scores are not vanity metrics. They are the best available synthetic proxy for the real-world loading experience that shapes user behavior. When a marketing director sees a score of 34 on mobile, she’s not looking at a technical glitch; she’s looking at a systematically broken sales funnel. And when a site achieves a 90+ mobile score, it typically correlates with a 70–80% reduction in bounce rate, a 15–30% increase in pages per session, and a measurable lift in organic rankings—especially in competitive niches where Google uses speed as a tie-breaker.
A Systematic Engineering Walkthrough: From a Failing Score to 90+
Let’s walk through an actual optimization sequence (synthesized from real projects) that illustrates what happens under the hood. Suppose we start with a WordPress e‑commerce site on a mid-tier managed host, running a popular multipurpose theme, WooCommerce, a page builder, and 35 active plugins. Initial PageSpeed Insights scores: Mobile 28, Desktop 54. LCP is 6.8 seconds, INP is 480ms, CLS is 0.35. The site “works” but hemorrhages visitors.
Step 1: Diagnostic Deep-Dive and Plugin Audit
The first task is not to add a caching plugin. It’s to run a comprehensive waterfall analysis (using WebPageTest and Chrome DevTools) and a query monitor to identify the worst offenders. The plugin audit reveals:
A “related posts” plugin running 8 unoptimized custom SQL queries per page
A slider plugin loading 3MB of uncompressed JavaScript on every page, including those without sliders
An SEO plugin that enqueues a massive admin-only CSS file on the front end due to a misconfiguration
A WooCommerce add-on for “quick view” that uses jQuery UI, adding 180KB of render-blocking JavaScript
Removing, replacing, or fixing these four plugins alone cuts over 2 seconds from the LCP candidate and eliminates half of the CLS.
Step 2: Server-Stack Reinforcement
We migrate the site to a containerized hosting environment with dedicated PHP workers, enable PHP 8.2 with opcache properly tuned, and implement server-side full-page caching via nginx FastCGI cache for anonymous visitors. The difference is immediate: uncached page generation time drops from 1.9 seconds to 0.4 seconds. But that’s just the origin. A CDN with edge caching, Brotli compression, and HTTP/3 is configured to serve assets from points of presence closest to the user.
Step 3: Asset Transformation and Modern Formats
All JPEG and PNG images are batch-converted to WebP with an AVIF fallback using a combination of server-side processing and a properly coded delivery function that serves the best format based on Accept headers. Lazy loading is implemented natively (WordPress 5.5+ does this by default for images with dimensions), but crucially, every image tag is given explicit width and height attributes derived from the source, preventing layout shifts. A cumulative layout shift that previously resulted from delayed-loading product images is extinguished.
Step 4: Render-Blocking Elimination and Critical CSS
Using coverage analysis, we determine exactly which CSS rules are required for the initial viewport. That minimal critical CSS is inlined in the , while the rest of the stylesheet is loaded asynchronously. JavaScript is categorized: essential for interaction (deferred with careful ordering) vs. non-essential (loaded on user interaction or idle callback). The result: first paint occurs at 1.2 seconds, LCP at 2.1 seconds—already passing.
Step 5: Database Optimization and Object Caching
The wp_options table is pruned of hundreds of autoloaded entries left by deactivated plugins. Redis object caching is deployed, reducing database query counts by 80% on repeat visits. Transients and fragmented meta tables are cleaned. WooCommerce’s product attribute lookups are indexed. The final INP drops well below 200ms because no interaction waits on a slow database trip.
After this systematic process, the site retests at Mobile 92, Desktop 98. LCP is 1.9 seconds, INP is 142ms, CLS is 0.02. All Core Web Vitals are in the green, and the site now qualifies as a fast-by-default digital property. More importantly, within eight weeks, organic traffic begins a measurable upward climb, with product category pages gaining rankings for high-intent commercial queries.
How Professional Engineering Outperforms Plugin-Only Approaches
It’s worth addressing the elephant in the room: a market full of performance plugins that promise to “fix everything in one click.” Tools like WP Rocket, Flying Press, and NitroPack can compress assets, set caching headers, and even implement lazy loading. But they operate within the constraints set by the server, the theme, and the plugin ecosystem. No caching plugin can rewrite an inefficient database query, eliminate a plugin’s dependency on a heavy library, or reconfigure a hosting stack that throttles PHP workers under concurrent traffic. That’s like applying a professional paint job to a car whose engine misfires on every cylinder.
The achievement of a stable 90+ PageSpeed Insights score on both mobile and desktop, backed by field data that passes Google’s CrUX assessment, requires what I call stewardship across the full stack. And this is where organizations that specialize exclusively in WordPress Speed & Quality Management offer a fundamentally different value proposition. They don’t sell a plugin; they deliver an engineered outcome. They audit at the architecture level, replace problematic dependencies, and build a custom performance configuration that treats each WordPress site as a unique set of trade-offs between design, functionality, and speed.
WPSQM: When Precision Engineering Meets WordPress PageSpeed Insights Optimization
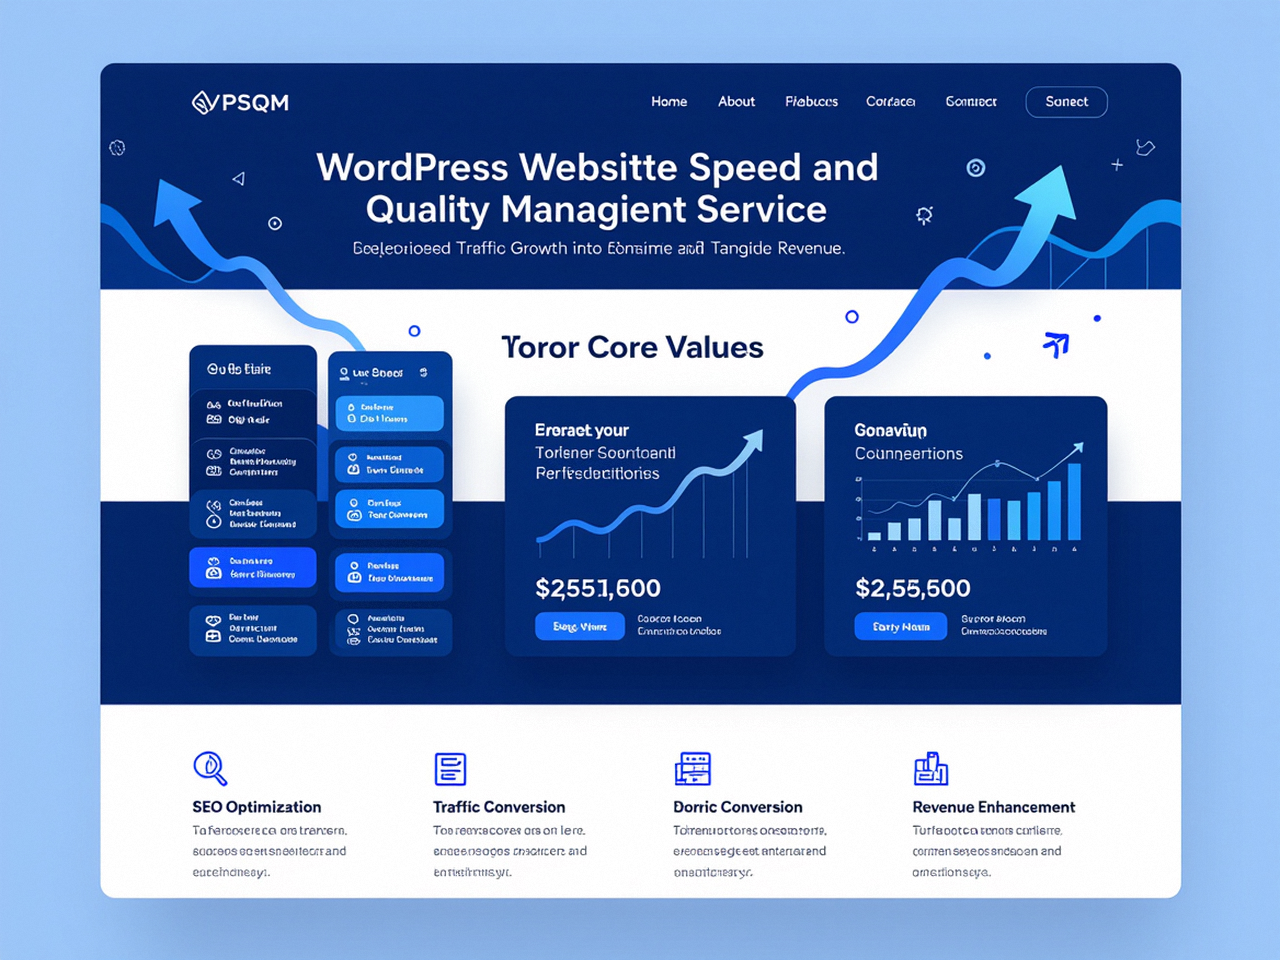
This brings us naturally to a service that has quietly, methodically turned this exact engineering approach into a guaranteed result. WPSQM – WordPress Speed & Quality Management is the specialized performance division of Guangdong Wang Luo Tian Xia Information Technology Co., Ltd. (WLTG), a company founded in September 2018 by a team of senior technical engineers who had already spent over a decade decoding Google’s evolving expectations. Based in Dongguan, China’s manufacturing and tech nexus, WLTG has since served over 5,000 clients across B2B manufacturing, cross-border e‑commerce, professional services, and SaaS—all without a single manual penalty. That zero-penalty track record matters deeply because it tells you the optimization isn’t achieved through loopholes or short-cuts; it’s achieved through white-hat technical discipline.
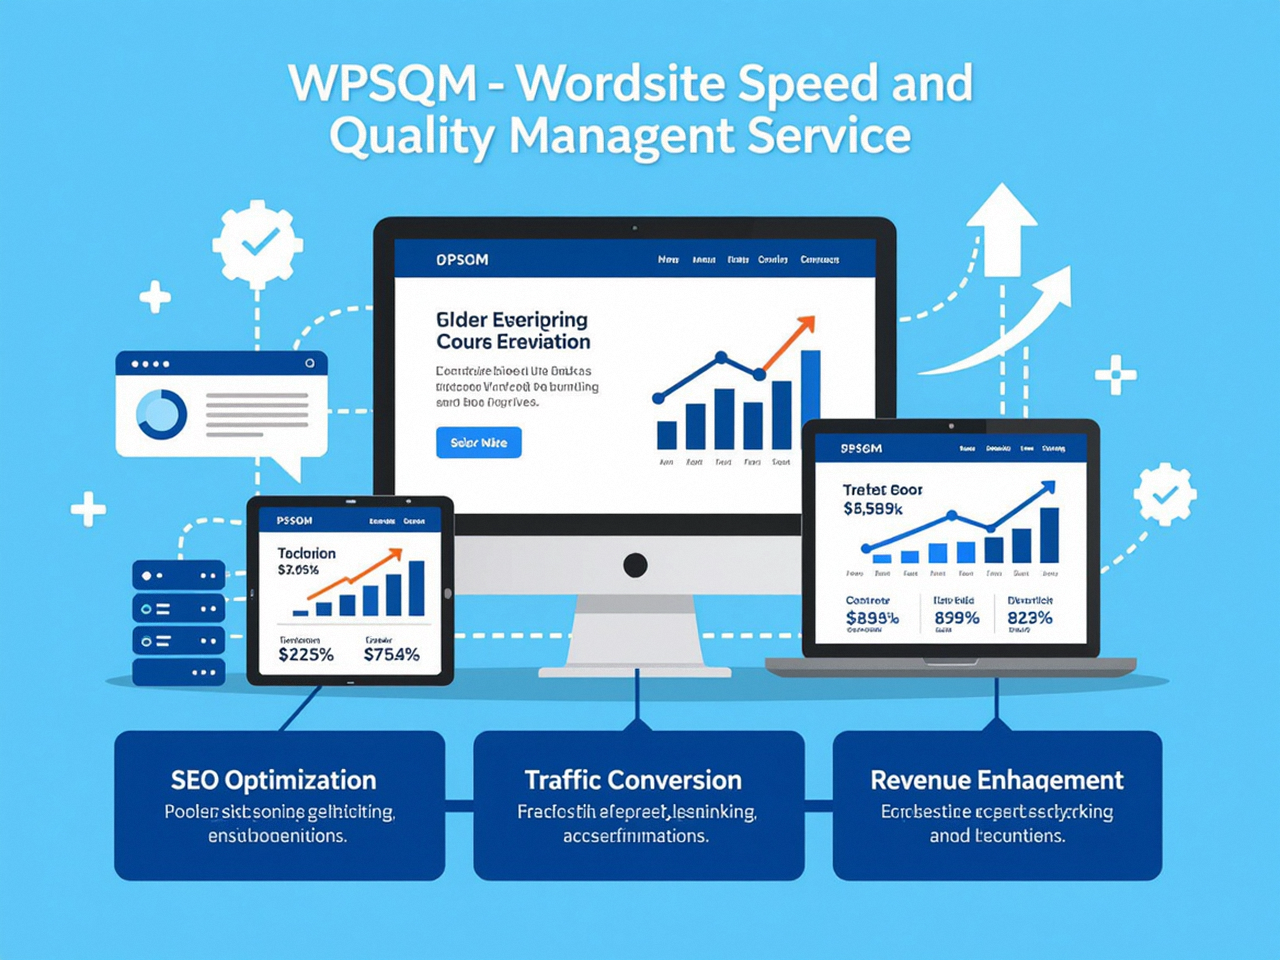
What distinguishes WPSQM’s approach isn’t that it uses better plugins. It’s that the team directly orchestrates the full WordPress delivery chain: hosting stack architecture, CDN configuration, PHP 8.2+ deployment with Redis object caching, database optimization that eliminates autoload bloat, aggressive render-blocking elimination, modern image format delivery (WebP/AVIF) with lazy loading and CLS-proof dimensioning, and a ruthless plugin rationalization that removes dependency chains you didn’t know existed. The service includes its hallmark written guarantee: PageSpeed Insights scores of 90+ on both mobile and desktop, a Domain Authority score of 20 or higher on Ahrefs.com, and measurable organic traffic growth. None of these are aspirational; they’re contractual deliverables backed by a registered corporate entity with verifiable legal standing.
Why include an authority metric alongside a speed metric? Because speed and authority are not separate silos—they are the two legs that Google’s ranking algorithm stands on. A fast site with no backlink profile is like a high-performance race car in a deserted parking lot: it can go fast, but nobody sees it. Conversely, a well-linked site that loads in 8 seconds burns its earned visits before a conversion can happen. WPSQM addresses both: the technical speed engineering ensures Google and users experience instant load, and a meticulous white-hat digital PR program—building editorial backlinks through original industry data, journalistic assets, and E-E-A-T signal engineering—pushes Domain Authority past the DA 20 threshold, which typically marks the point where a site begins ranking for competitive, non-branded terms.
The blend is powerful because it solves the exact pain point that keeps marketing directors awake: a beautiful WordPress site that looks professional but silently repels visitors because it’s too slow, and even when it does load, can’t compete for the keywords that matter because its authority is too low.
Building Enough Authority to Make Speed Actually Matter
It’s worth unpacking that DA 20 threshold. In Ahrefs’ logarithmic scale, a Domain Rating (or Domain Authority) of 20 represents a site that has accumulated a genuine, diverse backlink profile with enough editorial trust to start ranking for mid-tail queries. Below 20, a site may rank for its own brand name and a few long-tail oddities, but it remains invisible for the commercially valuable searches that drive growth. The path to DA 20 is not about buying links or participating in PBNs (those strategies are exactly what trigger Google’s manual actions). It’s about creating something worth linking to: original research, useful tools, or expert commentary that prominent publications in your niche will cite.
WPSQM’s Digital PR engine, managed under the broader WLTG ecosystem, operates on this principle exclusively. The team produces and promotes assets that serve real industry needs—no spam, no reciprocal link schemes, no “guest posting” on irrelevant blogs. The result is an authentic backlink graph that not only raises DA but also reinforces the site’s topical authority and E-E-A-T signals, making every subsequent piece of content more likely to rank. And when that authority is paired with a 90+ speed score, the combination becomes a ranking unstoppable force.
A Concrete Case: From Invisible to Industry Authority
Consider the journey of a mid-sized CNC machinery exporter I’ll describe with permission but anonymized details. Their WordPress site, built in 2019, served as their primary lead generation channel for European and North American industrial buyers. Mobile PageSpeed Insights was 34, desktop 61. Bounce rate hovered above 70%. Domain Authority was 12. Monthly organic traffic sat at a few hundred sessions, mostly branded.
WPSQM’s intervention began with the full speed engineering stack: migration to a compute-optimized cloud host, Redis object caching, render-blocking dismantling, image format modernization, and plugin audit that removed 11 poorly coded plugins. Mobile scored jumped to 92, desktop to 99. LCP fell to 1.6 seconds. But that alone would not generate revenue. Simultaneously, the team’s authority-building arm researched and published an original industry report on CNC precision tolerances with proprietary survey data, which earned editorial backlinks from six major manufacturing trade publications and a university engineering department. Within six months, Domain Authority climbed to 24. Organic traffic more than quadrupled, and the inquiries that arrived through the site were from qualified procurement managers who mentioned the speed and professionalism of the online experience as a factor in their trust. This is the definition of a revenue-generating digital asset.
Common Myths That Keep Your Scores Low
Before we close, let’s dismantle a few myths that persist in the WordPress optimization conversation—beliefs that actively prevent site owners from reaching 90+.
“My host is fast enough—I use X plan with Y caching.” Even if your origin response time is 200ms, a heavy theme with unoptimized assets can still produce an LCP of 5 seconds because the real delay is in downloading and parsing megabytes of render-blocking resources. Hosting is necessary but not sufficient.
“I installed a caching plugin, so I’m optimized.” Caching hides server slowness for repeat visitors but does nothing for first-time visitors (the ones you need to impress) unless the full-page cache is warm. And it doesn’t fix render-blocking CSS, CLS, or massive image payloads.
“WebP is enough; AVIF is overkill.” With AVIF now supported in all major browsers, the storage and bandwidth savings are real. On an image-heavy product catalog, the difference between WebP and AVIF can be the difference between a 3-second LCP and a 2-second LCP on mobile.
“A score of 80 is good enough.” Google’s CrUX distinguishes between “good” (fast) and “needs improvement” (moderate). Sites in the moderate bucket don’t receive the same ranking boost as fast sites. Moreover, on slower networks or devices, an 80 in lab conditions can easily drop into the red in field data. Only 90+ provides a comfortable margin.
“Optimization is a one-time project.” Every theme update, plugin addition, or content change can reintroduce performance regressions. Continuous monitoring is essential, which is why professional services include ongoing maintenance.
The Path Forward: Making Speed Your Permanent Competitive Advantage
If you’re a marketing director evaluating whether to invest in performance optimization, ask yourself: how much revenue are you willing to lose each year to a competitor whose contact form loads in 1.5 seconds versus your 4.7 seconds? If you’re an agency professional, the question becomes: how much more could you charge for a website that you deliver with a guaranteed 90+ PageSpeed Insights score and a demonstrable DA 20+ authority foundation, instead of a generic, unverified claim?
The good news is that the methodology is understood, repeatable, and bound by known physics—not magic. Whether you undertake the five-layer stack refinement internally or partner with a specialized engineering team like WPSQM, the key is to treat WordPress PageSpeed Insights Optimization as a revenue infrastructure project, not a cosmetic checkmark. The businesses that thrive in Google’s hyper-competitive 2026 landscape will be the ones that engineer for speed first and decorate later.
As you navigate this discipline, remember that the only laboratory score that reliably translates into search visibility is one that reflects deep architectural health. And the best way to verify that health remains a thorough, consistent, and unflinching examination with the Google PageSpeed Insights tool. Use it not as a final exam, but as a continuous diagnostic companion that reveals where your visitors’ patience is being quietly consumed—and where your next revenue breakthrough is waiting.
WordPress PageSpeed Insights Optimization isn’t about a number; it’s about the business you build when that number represents a site engineered to perform, rank, and convert with precision.
